The XLM price is in a very familiar situation, and traders are paying attention. Following weeks of drifting lower, XLM has slipped back into a falling wedge, the same pattern that sparked a key breakout earlier this year.
Now, the XLM chart looks almost like a replay. At the moment, the XLM price is hovering just above the $0.20–$0.22 range, a price zone that has repeatedly acted as strong support.
Because this setup has led to big moves before, the market is naturally wondering whether history is about to repeat itself.
What you'll learn 👉
XLM Is Showing the Same Playbook Again
Analyst Elite Crypto pointed out that XLM has now formed two nearly identical falling wedges this year.
The previous one ended with a sharp breakout and a strong rally, catching many traders by surprise. The current wedge has the same shape, the same tightening structure, and is sitting right at its potential breakout point.
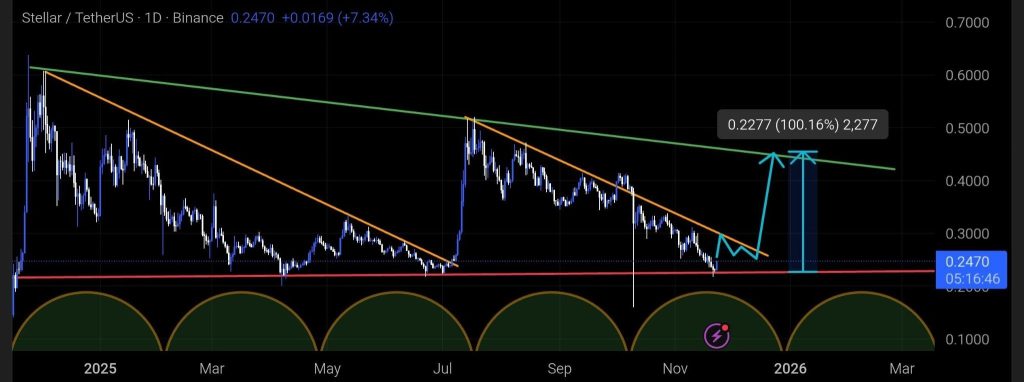
Elite Crypto believes that if the XLM price breaks out the way it did last time, a 100% move from here wouldn’t be shocking. Of course, no chart pattern guarantees upside, but when the same setup appears twice in the same year, people take notice.
A Support Zone That Keeps Delivering
The bullish case doesn’t rely on the wedge alone. Crypto Patel highlighted that the XLM price just touched the same $0.20–$0.22 support band that previously triggered rallies of 32%, 53%, and even 138%. That’s a pretty strong track record.
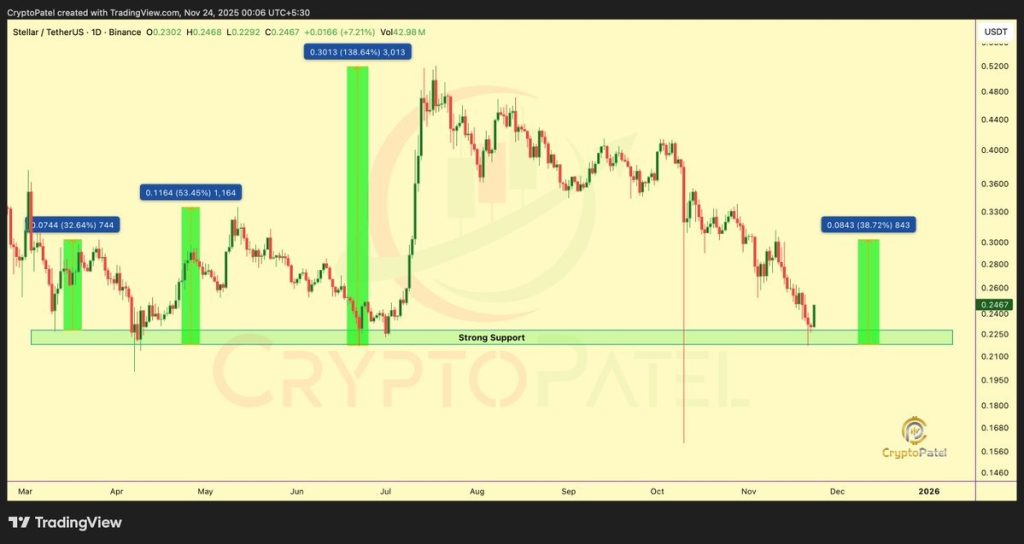
Every time the XLM price has dipped into this zone, buyers have stepped in, selling pressure has slowed, and momentum eventually flipped. So, seeing XLM return to this area again gives traders another reason to keep watching.
Read Also: Time to Buy Hedera at Current Levels? Analyst Updates His HBAR Price Outlook
What’s Next for XLM?
Now it all comes down to confirmation. XLM needs to break above the wedge’s descending trendline and actually hold the breakout, ideally with rising volume. A clean daily close above resistance would be the strongest sign that bulls are back in charge.
But if the XLM price loses the $0.20 support level, the setup weakens, and downside could open up. That’s why this area matters so much, it’s the line separating potential reversal from continued decline.
For now, the XLM chart is hinting at something interesting. It’s a familiar pattern, support is strong, and momentum looks ready to shift. If Stellar behaves in any similar way to what it did earlier this year, the next move could be much bigger than many expect.
Subscribe to our YouTube channel for daily crypto updates, market insights, and expert analysis.