Solana’s native cryptocurrency, SOL, has been on a remarkable upswing lately, surging approximately 18% over the past seven days. At the time of writing, SOL is trading around $152, showcasing the asset’s growing strength and positive sentiment in the crypto market.
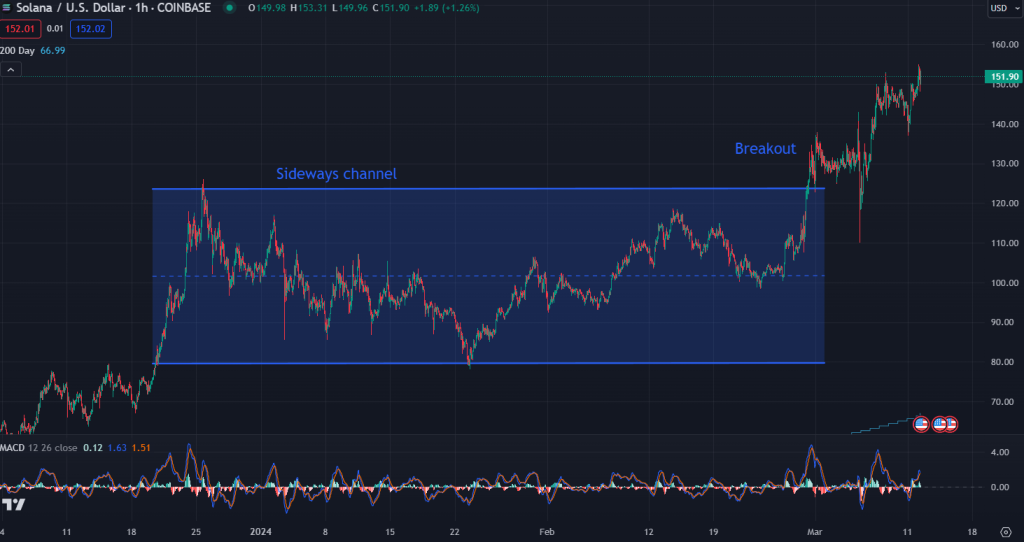
After a stellar performance in the latter half of 2023, when its price skyrocketed from $15 in June to over $120 in late December, SOL entered a consolidation phase, trading within a sideways channel between $80 and $120, as illustrated by the blue lines on the chart below. However, propelled by the positive momentum in the crypto market, SOL broke out of this range earlier this month, embarking on a “discovery mode” in search of new highs.
A key technical indicator supporting SOL’s bullish outlook is the Moving Average Convergence Divergence (MACD) line, which is currently above the MACD signal line. This crossover indicates that the trend strength is increasing, and the upward momentum is likely to continue in the near future.

Furthermore, the Relative Strength Index (RSI), a momentum oscillator that measures the speed and change of price movements, is painting a promising picture across multiple time frames. On the daily, weekly, 3-month, and 6-month charts, the RSI is hovering between 50 and 60, suggesting that SOL is in a healthy uptrend without being overbought. Interestingly, on the yearly chart, the RSI is around 75, indicating that the asset’s bullish momentum is particularly robust in the long-term perspective.
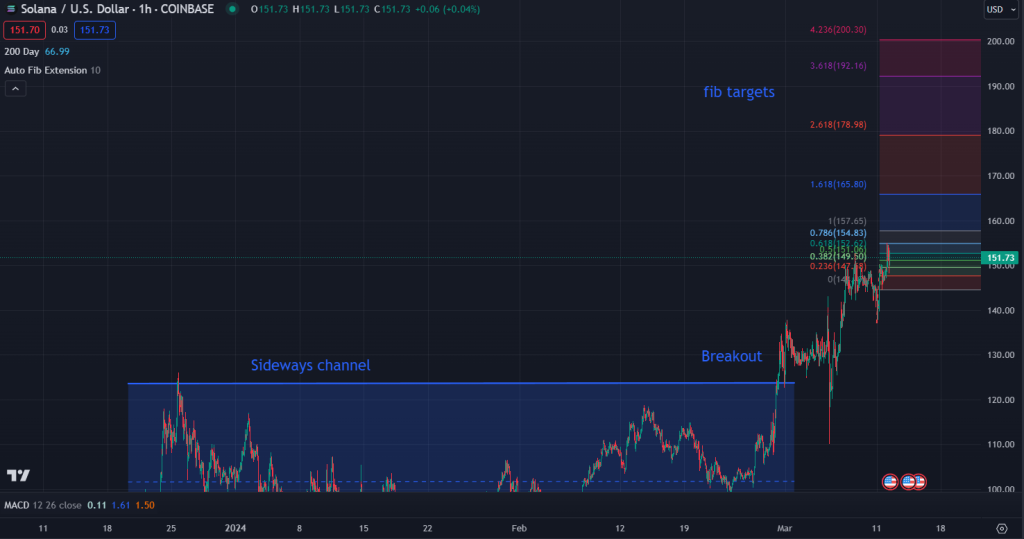
Based on Fibonacci extension levels, a technical analysis tool used to identify potential price targets, SOL has three significant targets in its sights. The first target lies at $178.98, in line with the 2.618 Fibonacci extension level. The second target is $192.16, corresponding to the 3.618 Fibonacci extension level. However, the most ambitious target is around $200, which aligns with the 4.236 Fibonacci extension level.

These Fibonacci levels are derived from the prior price swing, and their significance lies in the fact that they often act as potential support or resistance levels, where the asset may encounter buying or selling pressure. If SOL can break through these levels, it would signal a continuation of the uptrend and potentially pave the way for new all-time highs.
On the flip side, if SOL encounters resistance and retraces its gains, the first support level to watch is $143.8, in line with the 0.618 Fibonacci retracement level. A more substantial support level is found at $140.85, corresponding to the 0.796 Fibonacci retracement level.
Doge2014 raises 500K in days celebrating Dogecoin. Make potentially big profits and get in on exclusive airdrop!
Show more +For SOL to reach the coveted $200 target, it will need to maintain its bullish momentum and continue to attract buying pressure from investors. Positive news and developments within the Solana ecosystem, such as the launch of new projects or partnerships, could further fuel this uptrend. Additionally, a broader crypto market rally, driven by increased institutional adoption and regulatory clarity, could provide tailwinds for SOL’s ascent.
Investors and traders should closely monitor SOL’s price action, as well as the broader market sentiment, to make informed decisions. It’s crucial to exercise caution and implement proper risk management strategies, as the crypto market can be highly volatile and unpredictable.
We recommend eToro
Wide range of assets: cryptocurrencies alongside other investment products such as stocks and ETFs.
Copy trading: allows users to copy the trades of leading traders, for free.
User-friendly: eToro’s web-based platform and mobile app are user-friendly and easy to navigate.


