Solana (SOL) and Cardano (ADA) – are currently at significant turning points. This article delves into the technical analysis of these two cryptocurrencies, exploring the pivotal levels that could potentially shape their future trajectories.
From Solana’s critical $12 pivot point to Cardano’s intriguing triangle formation, we uncover the patterns and trends that could break the current status quo and set the stage for their next big moves.
Doge2014 raises 500K in days celebrating Dogecoin. Make potentially big profits and get in on exclusive airdrop!
Show more +Solana (SOL) at a Crossroads: The $12 Pivot Point that Could Dictate the Future of SOL
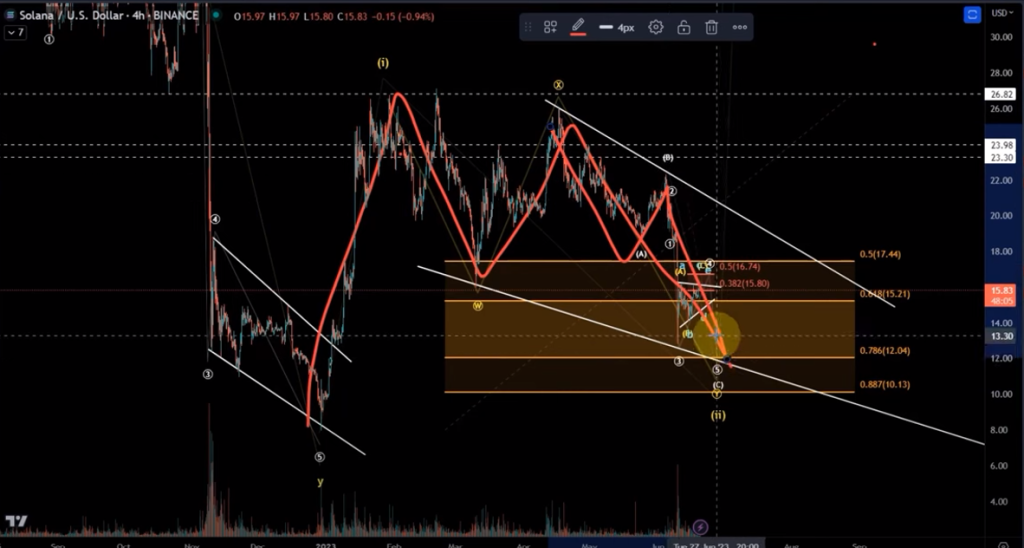
Solana (SOL) is currently navigating a critical juncture. The $12 mark is a significant pivot point for this digital asset. If this level is breached, it could potentially trigger a downturn leading to new bear market lows. However, as long as this level remains intact, there’s a likelihood of an upward trajectory, potentially reaching $26 and beyond.

Source: TradingView
Currently, Solana is in a position where a turnaround could occur at any moment, but there’s no concrete evidence to support this yet. The bullish scenario suggests an initial wave to the upside followed by a WXY structure on the downside.
In the more granular analysis, Solana is still expected to hit one more low due to two factors: the eight-wave count suggests one more low, and the asset is currently below the Fibonacci resistance for this Wave 4 at $16.74. A more bullish scenario would require the price to rise above at least $19.70. Until then, a downward move is still in progress.
However, if Solana manages to break above the $12 level and sustain it, the market could witness a bullish trend. But if it fails to hold this level, the market could shift towards a bearish trend, potentially leading to new lows.
Cardano (ADA) in a Holding Pattern: The Triangle Formation that Could Break the Sideways Trend
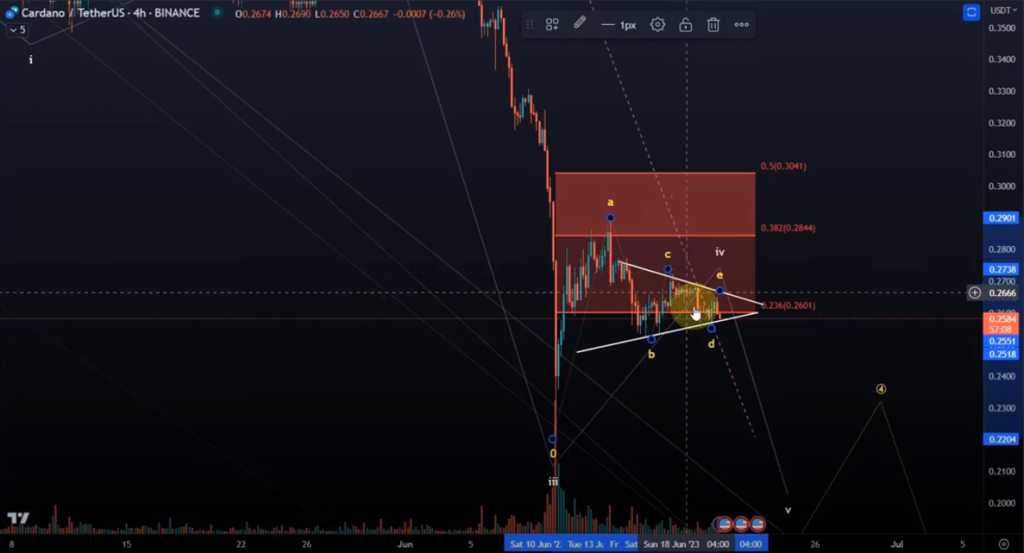
Cardano (ADA) is currently exhibiting a rather uneventful performance, moving sideways for the past few days. However, this is not surprising for those who have been closely monitoring the market trends. The digital asset has been forming a triangle pattern, which is a common occurrence in technical analysis. This pattern is characterized by higher lows and lower highs, suggesting a contraction in price volatility and a potential breakout in the near future.

Source: TradingView
At present, ADA has completed an A, B, C, D, and possibly E wave within the triangle. The E wave can always go a little higher, but as long as it stays below the C wave high of 27.3 cents, a downward move is likely. The first indication of a downward breakout would be a break below 25.7 cents, the D wave low. The confirmation would be a break below the B wave low at 25.2 cents.
However, it’s important to note that there’s no guarantee the triangle will break to the downside. If ADA breaks above the C wave high, two scenarios could unfold. First, the C wave could simply be extending, leading to an extended triangle. Second, the wave 4 could be going a little higher, suggesting a standard ABC structure in which the B wave could be a triangle and the C wave could move higher.
In summary, the current market conditions suggest that as long as ADA’s price stays below the 27.3 cent level, another low is expected in a wave 5, potentially around 17 cents. However, if ADA breaks above the C wave high, it could signal a higher wave 4. Regardless, as long as the price doesn’t break above the 30.4 cent level, another low is expected.
As always, this analysis is based on current market conditions and trends. Cryptocurrency investments come with their own set of risks, and it’s crucial to do your own research and consider your financial situation carefully before investing.


