Solana price has pulled back sharply over the past few sessions, but one widely followed technical indicator is now flashing a potential buy signal.
The token is trading around $187.35 after sliding from the $200 region. According to market analyst Ali, the TD Sequential indicator suggests the current pullback may be nearing exhaustion, raising the possibility of a short-term bounce.
The analysis comes as traders assess whether SOL price will hold a key demand zone between $182.5 and $185.
While momentum has weakened in recent days, price action on multiple candles shows signs of potential support forming at these levels.
What you'll learn 👉
TD Sequential Indicator Flashes Buy Signal For SOL
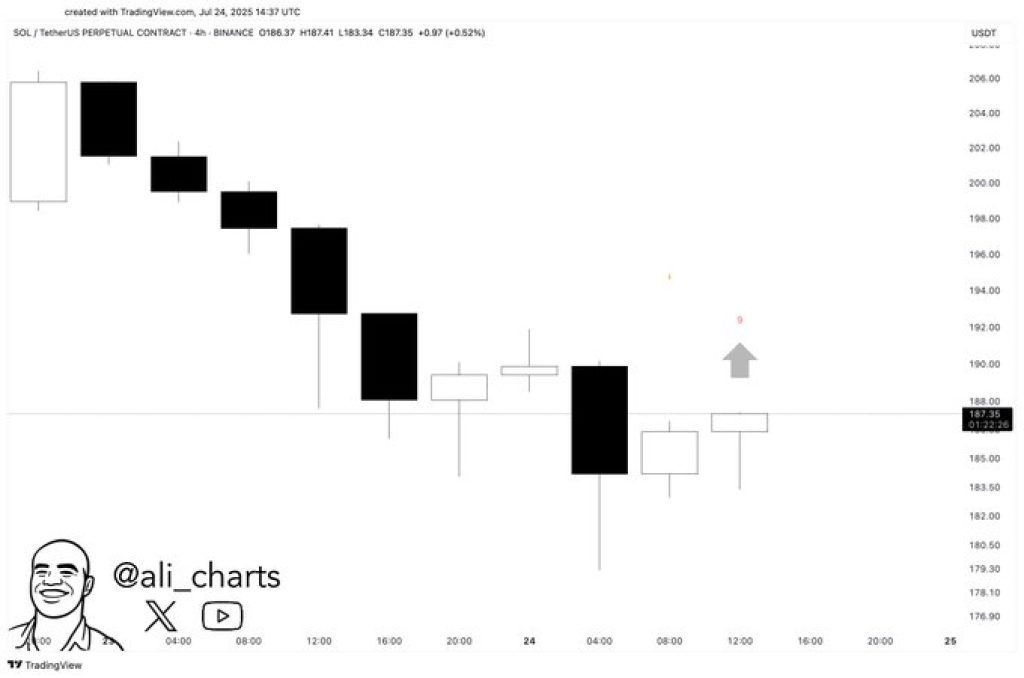
On the 4H chart, the TD Sequential indicator has printed a “9” buy signal. This tool is designed to identify potential reversal points after a defined trend sequence. A 9-count can indicate that selling pressure is fading, particularly when it appears near support zones.
Ali, who shared the chart and indicator reading on X, stated that the TD Sequential points to a buying opportunity.
The post, which includes a minimalistic candle chart, suggests that Solana price could stage a bounce from current levels. The visual also features a small upward arrow, hinting at a potential short-term move toward the $190–$194 range.
Solana Price Action Shows Signs of Stabilization
Solana has been trending lower on the 4H chart, with a series of bearish candles taking it from above $200 to the mid-$180s.
However, the latest price action shows a possible shift. It is a long candle with a big lower wick, showing the $182 level is being defended by the buyers, after a strong bearish move.
Subsequently, there have been two small white-bodied candles around $187, which showed some respite in the downtrend. Those types of candles are to be seen during the initial phases of reversals and even without indicators like TD Sequential.
Read Also: XRP Price Crashes – Here’s Why You Should (NOT) Be Worried
Aside from that, the $182.5 to $185 area is turning into a very important support area on the SOL chart. Buyers entered at these levels in the recent downtrend.
A hold of this area by the SOL price could manifest a short-term recovery. A move above the $190 level would add more weight to the bullish perspective signaled by the indicator.
If support fails, however, SOL might test lower levels, and the next region of potential demand would be near $175. Traders are waiting for price structure and volume confirmation before establishing new positions.
Solana Price Short-Term Outlook and Market Sentiment
While the broader trend has shown weakness, current signals are drawing interest from technical traders.
The TD Sequential reading, combined with signs of buyer activity near support, presents a setup for a potential bounce.
Market sentiment around Solana price remains mixed, but lower timeframe indicators are now shifting focus toward recovery scenarios. The coming sessions will likely determine whether SOL regains momentum or extends its correction.
Subscribe to our YouTube channel for daily crypto updates, market insights, and expert analysis.