
The price of Solana is now in a correction, falling below important support levels as the crypto market gets more volatile. After hitting nearly $300 before, it’s now testing the $148-$160 range – an important area that could decide where it goes next.
On X, experienced financial trader Matthew Dixon talked about Solana’s price movement. He said this drop is just a deeper correction, not a long-term downward trend. Dixon expects this phase will be followed by an upward move that could push SOL to a new all-time high.
What you'll learn 👉
SOL Chart Analysis: Elliott Wave Structure Suggests Potential Recovery
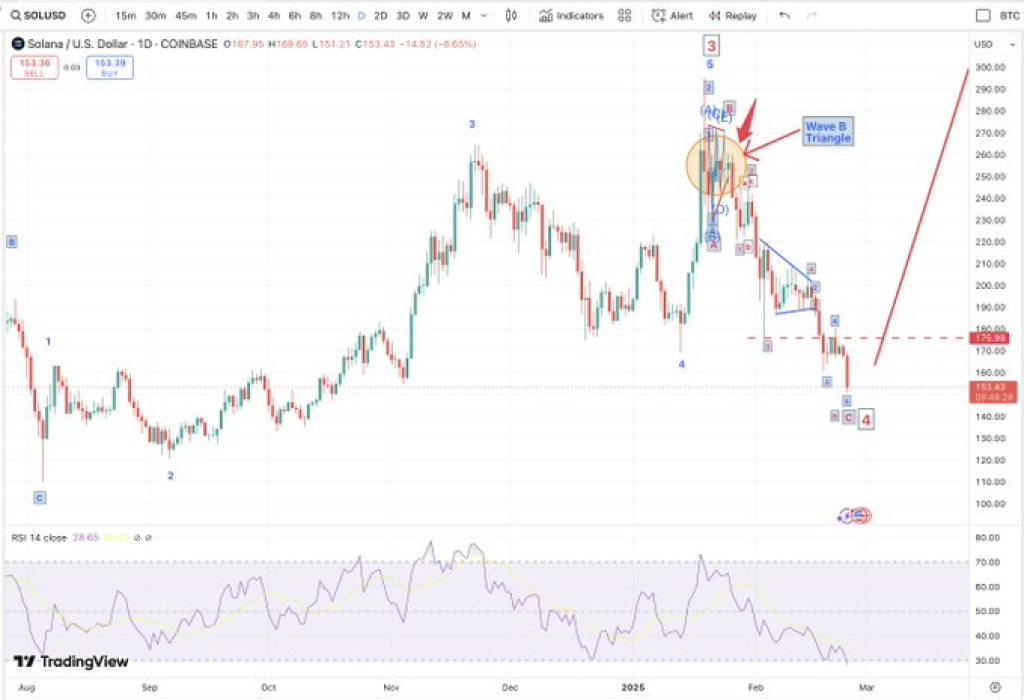
Solana’s movement follows Elliott Wave Theory – a five-wave upward move followed by an ABC correction. This includes a strong rise in Wave 3, a small pullback in Wave 4, and an attempt at new highs in Wave 5. After peaking, Solana’s price entered a correction showing a typical ABC pattern.
An interesting part of this correction is a Wave B triangle formation, which suggests a brief consolidation before more downward movement. As Wave C seems to be finishing its decline, traders are watching the $148-$160 range closely to see if this level will hold and lead to an upward reversal.
Solana Key Support and Resistance Levels in Focus
Technical indicators suggest that the $148-$160 range is a key support level. If Solana’s price maintains its position above this zone, there is a possibility of a strong rebound. If the price falls below $148, we could see more losses.
Looking at resistance, the $250-$260 range that didn’t hold during the drop remains important. Breaking above this would show renewed upward momentum and possibly retest previous highs.
The RSI for Solana sits at 28.65, suggesting it’s oversold. When RSI hits these levels, prices often bounce back – we might see a recovery if buyers step in.
Dixon thinks that despite the recent drop, the market is still in a bullish phase overall. If this is a Wave 4 pullback, like he suspects, Solana’s price could push past $300 in the next move.
Read Also: Onyxcoin (XCN) Price Struggles Below Key Resistance: Is Recovery on the Horizon?
Solana Market Outlook and Future Price Action
Traders are watching closely to see if Solana holds these key support levels. What happens in the next few days will show whether it can maintain its bullish structure or drop further.
Dixon’s view matches Elliott Wave analysis – this looks like a correction, not a long-term downtrend. If support holds, Solana’s price could make a strong move up toward new highs.
Subscribe to our YouTube channel for daily crypto updates, market insights, and expert analysis.

We recommend eToro
Wide range of assets: cryptocurrencies alongside other investment products such as stocks and ETFs.
Copy trading: allows users to copy the trades of leading traders, for free.
User-friendly: eToro’s web-based platform and mobile app are user-friendly and easy to navigate.


