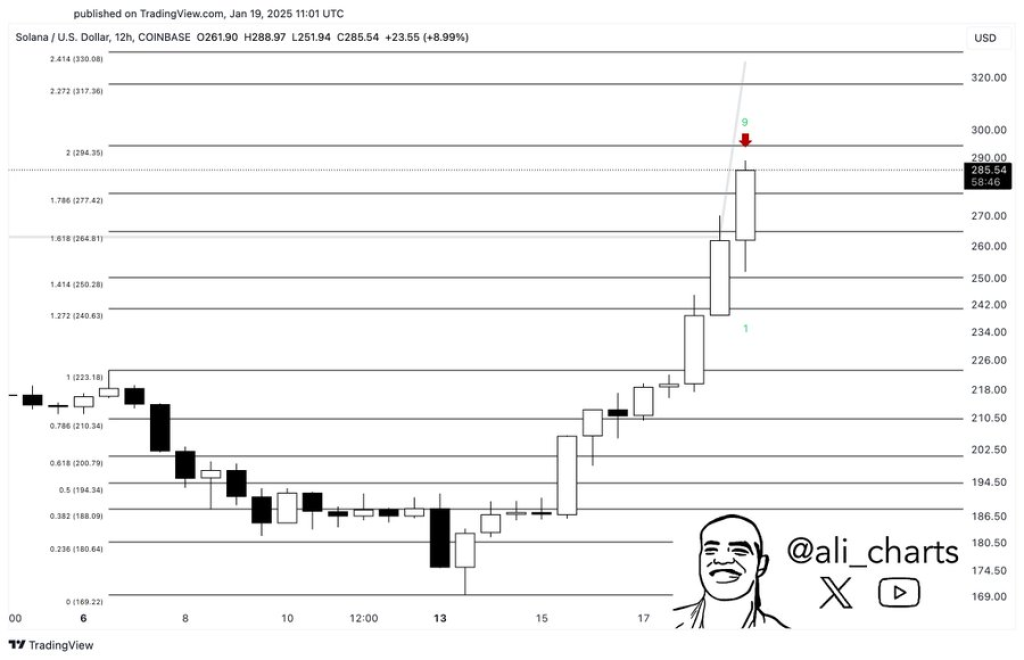
Solana’s bullish spike might be coming to a temporary halt based on some information on its chart. Popular crypto analyst Ali has identified a potential bearish signal for Solana (SOL), suggesting that the SOL rally might be due for a correction. According to their latest analysis, a key technical indicator is flashing warning signs that traders should watch closely.
The TD Sequential indicator has just displayed a sell signal on Solana’s 12-hour chart, as pointed out by Ali in their market analysis. This signal typically emerges when an uptrend may be reaching its exhaustion point, potentially leading to a price correction in the near term.
Solana’s price has recently pushed up against significant resistance, currently testing the crucial $294.35 level, which corresponds to the 2.0 Fibonacci extension. The cryptocurrency has shown remarkable strength in recent trading sessions, having already broken through previous resistance points at $264.87 and $277.42. However, as Ali notes, this very strength might now be setting the stage for a healthy pullback.
Read Also: AAVE Price Breaks Out of Key Pattern: Here’s Why It Could Climb Higher
What you'll learn 👉
What to Watch Next
The immediate price action suggests caution might be warranted. Recent candlestick patterns show diminishing momentum near the $290 mark, despite the overall bullish trend remaining intact. Ali’s analysis suggests that traders should keep a close eye on several key support levels should a correction materialize.
In the event of a pullback, traders should watch the $277.42 mark as the first significant support level. Below that, $264.87 represents another crucial support zone that could help stabilize any decline. For those looking at deeper corrections, the $250.28 level could provide substantial support if reached.

Upside Potential Remains
Despite the bearish signal, it’s worth noting that if Solana continues its upward momentum against expectations, the next major resistance level sits at $317.36. However, as Ali emphasizes through the TD Sequential indicator reading, the probability currently favors some degree of correction before any significant upward movement.
The combination of technical indicators and price level analysis suggests that while the long-term outlook may remain positive, some near-term caution might be prudent.
Subscribe to our YouTube channel for daily crypto updates, market insights, and expert analysis.
We recommend eToro
Wide range of assets: cryptocurrencies alongside other investment products such as stocks and ETFs.
Copy trading: allows users to copy the trades of leading traders, for free.
User-friendly: eToro’s web-based platform and mobile app are user-friendly and easy to navigate.


