The SOL price has been under pressure, sitting far below its all-time high, and that’s exactly what’s catching traders’ attention. A recent take from Crypto Patel points out something interesting, Solana is still down around 77% from its peak, even after proving it can deliver explosive rallies in the past.
That contrast is what’s driving the current narrative. Many remember when Solana dropped to single digits in 2022 and was written off, only to bounce back with a massive 2,000%+ move. Now, with the SOL price once again deep below its highs, some are starting to wonder if history could repeat itself.
What you'll learn 👉
A Look Back at the Last Cycle
To get a sense of what could come next, it helps to glance at the past. Patel shared a chart showing the last cycle, Solana hit around $280 at its peak in late 2021, then plunged all the way down to roughly $8.79. That crash erased almost all of its value, but it also set a clear bottom for the next move.
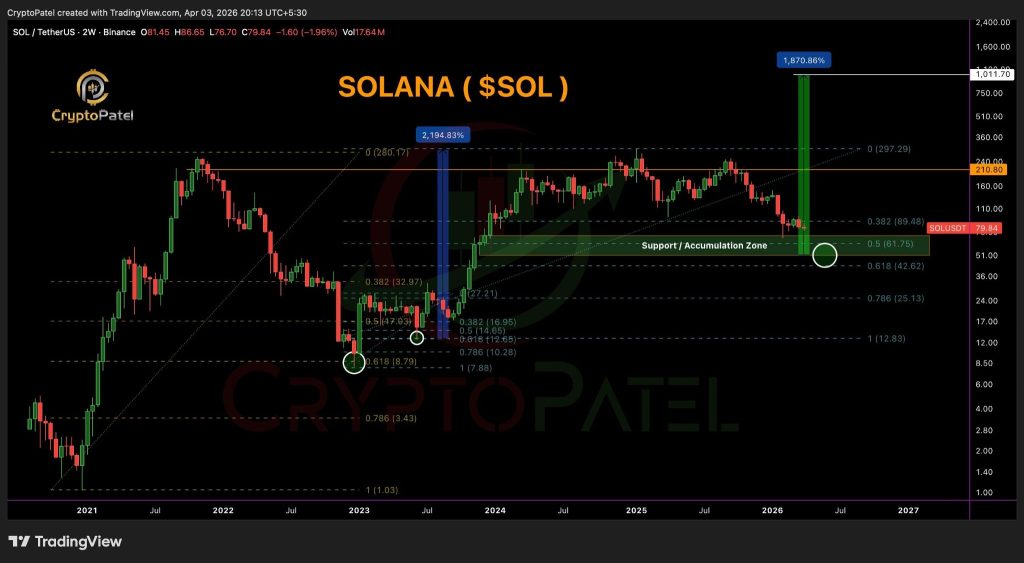
What’s interesting is where that bottom formed. It landed right at a key Fibonacci level, the 0.618 zone, often called the “golden ratio.” From there, the SOL price didn’t just recover, it exploded. Over the next year and a half, it climbed more than 2,100%, eventually reclaiming the $280 range.
That kind of move is why traders still pay attention to these macro levels. When they hold, they can mark the beginning of major cycles.
Read Also: $10,000 Into PEPE, DOGE, TRUMP, and Other Meme Coins… Now Just $783? The Brutal Reality
Where the SOL Price Stands Now
Fast forward to the current cycle, and the picture looks familiar, but not identical. Solana reached a new peak near $297 before entering another correction phase. The SOL price is now around $79, which puts it down more than 70% from that high.
We had a look at the chart, and the price is currently moving near an important level around $89, which acts as the first major support. But there’s a catch—the projected accumulation zone sits lower, roughly between $51 and $70. That’s the range where stronger buying interest could step in.
Right now, the SOL price hasn’t quite reached that zone yet, which leaves room for another leg down before a more convincing bottom forms. Volume also hasn’t shown strong conviction, which usually means the market is still undecided.
Solana Eyeing the $1,000 Mark
This is where things get interesting. The chart outlines a potential path where, if Solana finds support in that $51–$70 range, it could follow a similar recovery pattern to the last cycle. The projected upside? Around $1,000.
That would mean a move of roughly 1,800% from the bottom of the accumulation zone. It’s a huge number, but it’s slightly smaller than the previous cycle’s rally, which fits the idea that returns tend to decrease over time as assets mature.
Of course, for that to happen, the SOL price needs to actually find a bottom and hold it. If the accumulation zone fails, then the next key level sits closer to the $42 range, which would act as a deeper support.
Read Also: “Game Over” for Competitors? The XRPL DEX Could Be a Game-Changer
What to Watch Next for SOL
For now, the focus is on how the SOL price behaves around these key levels. A strong bounce from the current range could be an early sign of strength, but a move down into the $51–$70 zone would align more closely with the broader cycle pattern.
The bigger picture here is simple. Solana has been through this kind of cycle before, deep correction followed by a powerful recovery. The question isn’t whether it can rally, but from where that rally begins.
If history repeats itself, the current weakness in the SOL price might just be the early phase of a much bigger move. For now, though, traders are likely to stay on the sidelines, waiting to see if those key levels hold before getting more confident.
Subscribe to our YouTube channel for daily crypto updates, market insights, and expert analysis.