
Solana has not had an easy few months. SOL price once traded near $250 in September, only to slide lower alongside the broader crypto market. That drop of roughly 50% has tested patience and confidence. Still, charts often tell stories that prices alone miss, and one analyst believes Solana may be closer to a turning point than it looks.
CryptoCurb, known on X as curb.sol, shared a technical view that highlights several signals lining up at once. Taken together, those signals suggest SOL price could be entering a new phase rather than continuing the same grind lower.
What you'll learn 👉
Monthly Support Near $125 Has Acted As A Price Floor For Solana
Price history shows Solana repeatedly finding buyers around the $125 area. This level stands out on the monthly chart as a zone where selling pressure has slowed and candles have stabilized. Support like this matters because it reflects a price area where demand has consistently stepped in before losses deepened.
Solana price revisited this zone after the sharp decline from the September high. Instead of slicing straight through, price action compressed and began moving sideways. That behavior often signals that selling momentum is losing strength rather than accelerating.
CryptoCurb points to this monthly support as the foundation of the current setup. Holding above $125 does not guarantee a rally, yet it changes the conversation from free fall to base building.
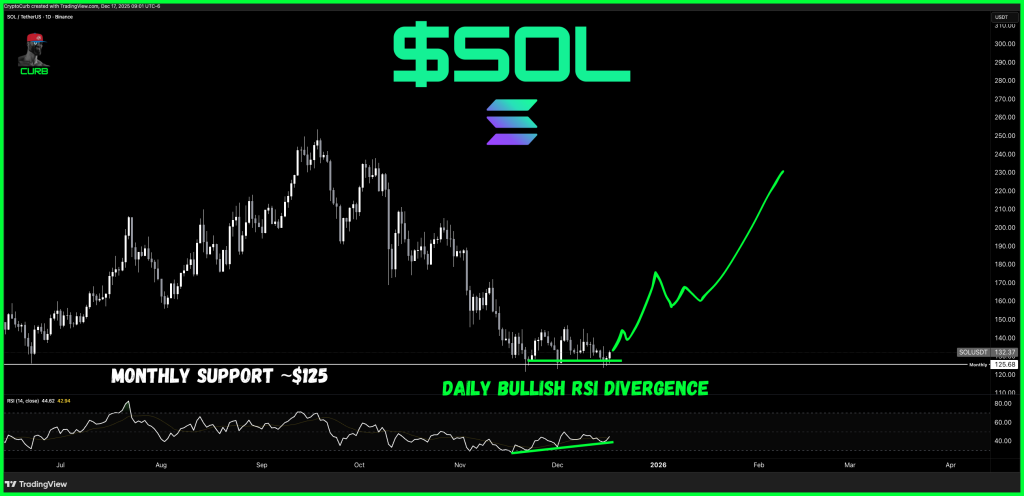
Daily Bullish RSI Divergence Shows Momentum Shifting Beneath SOL Price
Momentum indicators can reveal shifts before price reacts. The daily Relative Strength Index on Solana offers one of those clues. While SOL price pushed to similar or slightly lower lows, the RSI formed higher lows during the same period.
This pattern is known as a bullish RSI divergence. It suggests downside momentum is weakening even if price has not turned higher yet. Such divergences often appear near important bottoms, especially when they align with higher time frame support.
CryptoCurb highlights this daily bullish RSI divergence as a key part of the Solana outlook. Momentum no longer confirms the recent selling pressure, which opens the door for a potential rebound if buyers follow through.
Solana Price Structure Suggests A Base Rather Than Continued Breakdown
Zooming out, recent Solana price action looks more like consolidation than collapse. Candles have narrowed, volatility has cooled, and price has spent more time moving sideways above support. Markets often pause like this after steep drops as participants reassess value.
This structure contrasts with earlier phases of the decline when lower highs and lower lows printed quickly. Now, the chart shows attempts to stabilize rather than accelerate downward. That shift does not predict timing, though it does suggest conditions are changing.
CryptoCurb interprets this structure as a strong bottom formation attempt. The idea rests on multiple signals aligning instead of a single indicator flashing green.
Sentiment Around SOL Has Reached Extreme Pessimism Levels
Sentiment tends to swing further than price. Periods of sharp declines often leave traders cautious and disengaged, especially after large drawdowns like Solana’s slide from $250. CryptoCurb notes sentiment around SOL appears extremely low compared to earlier in the year.
Extreme pessimism alone does not move markets. Combined with technical stabilization, it can create conditions where even modest buying pressure has an outsized impact. When many participants expect further downside, upside surprises tend to travel faster.
Read Also: Here’s Why Bitcoin Price Is Holding Firm While Top Altcoins Keep Bleeding
This context helps explain why analysts watch moments like this closely. The disconnect between weak sentiment and improving technical signals often precedes meaningful shifts.
CryptoCurb’s chart outlines a scenario where SOL price could gradually work higher if support continues to hold and momentum keeps improving. The projection sketched on the chart points toward a recovery path rather than a straight line move.
Solana has already shown it can move quickly once momentum flips. Previous cycles included long periods of compression followed by sharp expansions. This setup shares some of those characteristics, though outcomes always depend on follow through and broader market conditions.
Subscribe to our YouTube channel for daily crypto updates, market insights, and expert analysis.