Solana price drift followed a clear structure that had already been mapped out on higher time frames. That structure is now shaping the next phase for SOL price, and the latest chart shared by Crypto Patel on X explains why this zone matters a lot.
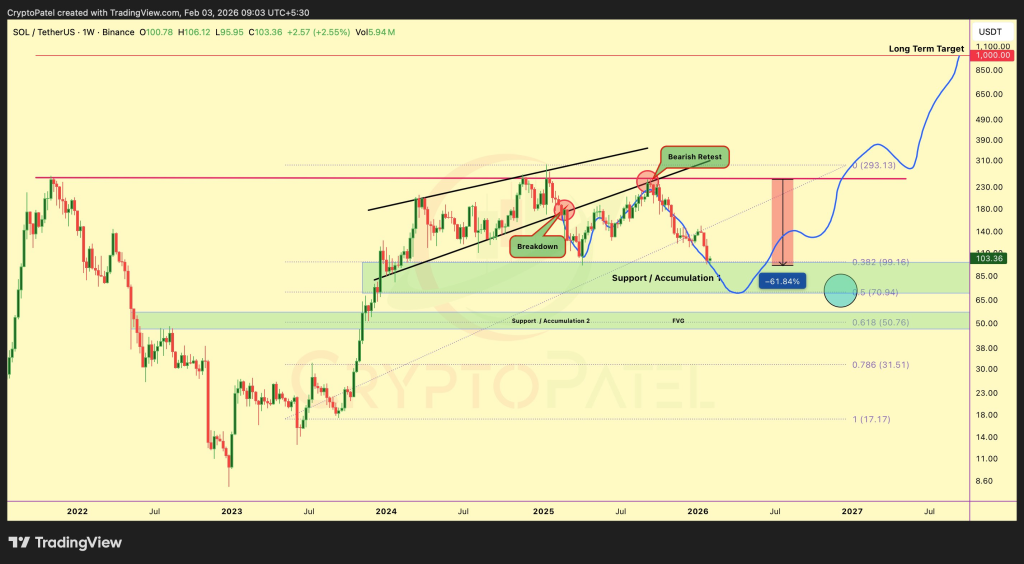
Solana spent months climbing inside a rising channel before price action started to lose balance near $230. Crypto Patel noted that region as a critical decision zone, where upside strength began to fade and sellers slowly took control. The chart shows repeated failures near the channel top, followed by a clean loss of trend support. That loss changed the entire rhythm of SOL price.
Once the structure broke, Solana price rolled over in stages rather than collapsing in a single move. Each bounce failed lower, which confirmed that momentum had already shifted. SOL eventually slid toward the $95 area. It lands close to a 60% drawdown from the peak.
SOL Price Forecast: Trading Inside A Clear Accumulation Zone
Current Solana price action sits inside what Crypto Patel labels as accumulation territory. The chart highlights a green support band stretching roughly between $99 and $71. This zone lines up with prior consolidation ranges and key Fibonacci retracement levels. Buyers defended this area in the past, and price memory tends to matter in markets like this.
SOL price reaching this region did not happen after a panic spike. The weekly structure shows price slowing down rather than accelerating lower. Crypto Patel notes that this behavior often signals absorption rather than distribution. Selling pressure appears to be getting met instead of expanding.
Deeper SOL Price Levels Still Exist If Weakness Continues
The chart also maps a secondary zone lower on the range. That area sits between $57 and $46 and aligns with deeper historical demand. Crypto Patel describes this region as a potential final base if broader market conditions stay heavy. Solana price has not reached that level yet, though the roadmap is visible if support fails above.
Nothing on the chart suggests a straight line move in either direction. Price could spend time moving sideways as liquidity builds. That process often feels slow and uncomfortable, though it plays a role in resetting long term structure for assets like Solana.
Read Also: Here’s How Chainlink (LINK) Solved the “Pricing Blind Spot” for RWA Markets
Crypto Patel stays clear that the current phase does not cancel the larger Solana story. The long term curve on the chart projects higher price levels once accumulation completes. That projection stretches toward previous highs and beyond, though timing remains open ended. SOL price needs patience here more than speed.
Subscribe to our YouTube channel for daily crypto updates, market insights, and expert analysis.