CryptoJobs, a top analyst on X (formerly Twitter), updated his followers about a potentially bullish setup that could send Solana’s price into a rally.
He mentioned that a breakout or additional consolidation could influence the price action in the upcoming days, as these charts indicate a significant juncture.
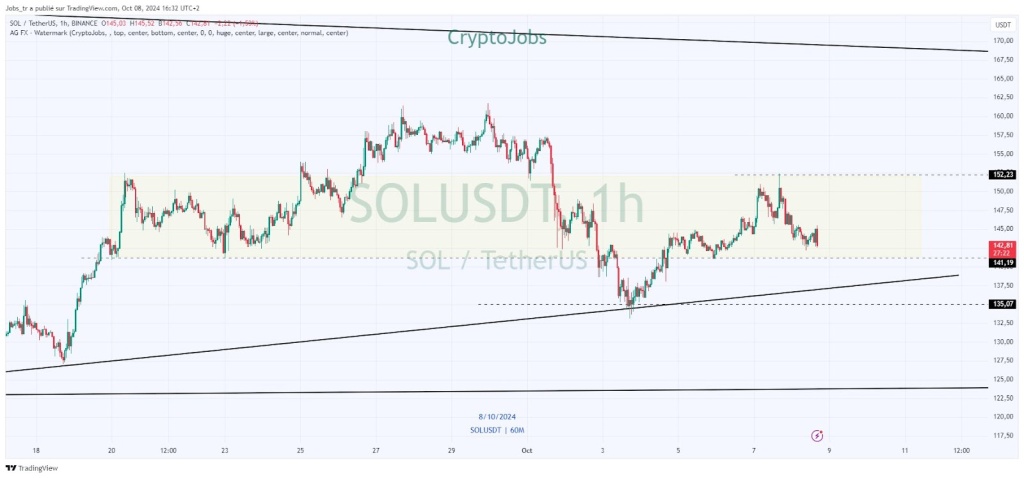
Still, the Solana (SOL) price is in a narrow consolidation range, and traders are watching the $152 barrier figure.
Doge2014 raises 500K in days celebrating Dogecoin. Make potentially big profits and get in on exclusive airdrop!
Show more +What you'll learn 👉
Neutral Zone and Key Levels
The SOL price is within a neutral zone, fluctuating between $142 and $152. This range has witnessed multiple tests of both support and resistance, signaling indecision in the market.
Immediate support is found at $141.19, while lower levels of support include $135, $128, and $120. As long as SOL’s price stays above $120, the overall bullish outlook remains intact.
An ascending trendline from previous price movements indicates buyers are gradually stepping in at higher levels.
This ascending support line adds to the bullish sentiment, though failure to maintain these levels could lead to downside pressure. On the upside, breaking the $152 resistance is vital for a bullish continuation, potentially leading the SOL price toward $160 and higher levels.

Solana Chart Analysis: Bull Flag and Symmetrical Triangle Patterns
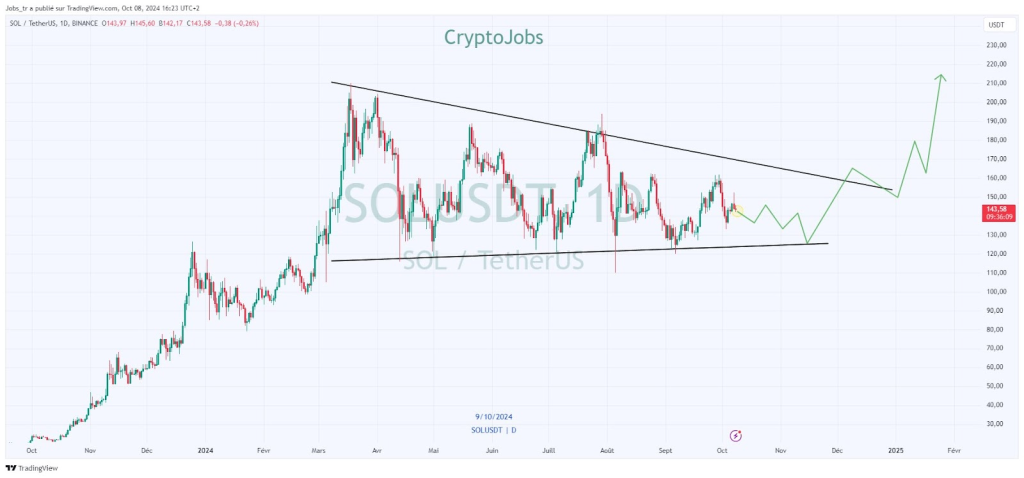
The SOL daily chart reveals two important formations: a potential bull flag and a symmetrical triangle. The bull flag pattern typically signals consolidation before a continuation of the bullish trend, while the symmetrical triangle suggests that the SOL price is converging, with a breakout becoming increasingly likely.

The significance of this level is further highlighted by the resistance at $152, which corresponds with the upper point of the symmetrical triangle.
Furthermore, a strong advance past this barrier would open the door for a surge toward $180 or even $200. A pullback toward $100 is conceivable on the downside if the support area around $120 is broken and would invalidate the bullish formation.
Read Also: $1,000 in Solana (SOL) or Internet Computer (ICP): Which Could Become More Profitable?
Potential Scenarios for Solana (SOL) Price
If Solana can break the $152 resistance, the next targets are $180, with a possible surge toward $200 or more, depending on market momentum.
However, failure to break this level could see SOL price retesting support at $135, with additional downside risk toward $120. Despite the neutral short-term outlook, the presence of the bull flag and ascending trendline suggests that the overall sentiment remains positive.
As the market awaits SOL’s next move, traders will be watching the $152 level. Whether it results in a rally toward $250 or a downturn remains to be seen, but the current consolidation hints at significant movement ahead.
Subscribe to our YouTube channel for daily crypto updates, market insights, and expert analysis.
We recommend eToro
Wide range of assets: cryptocurrencies alongside other investment products such as stocks and ETFs.
Copy trading: allows users to copy the trades of leading traders, for free.
User-friendly: eToro’s web-based platform and mobile app are user-friendly and easy to navigate.


