
Solana price is showing a notable split between network activity and short-term price momentum.
Santiment data shows Solana’s network growth has risen 124% since early September, with around 1.71 million new wallets now being created each day.
Daily active addresses have also increased 58% over the same period, reaching roughly 4.27 million.
At the same time, SOL is trading near $115.70 after pulling back from the $120-$123 area.
What you'll learn 👉
Solana Network Activity Is Expanding Fast
Santiment’s chart shows two important trends developing together.
Network growth, which tracks new wallets appearing on Solana, has moved from below 800,000 per day in early September to around 1.71 million.
Daily active addresses have also moved higher, reaching approximately 4.27 million.
That means Solana is not only creating more wallets. Existing users are interacting with the network at a higher rate too.
The combination is more meaningful than either metric on its own.
New wallets can sometimes appear without much activity afterward. But rising active-address numbers indicate that a larger portion of the user base is actually interacting with Solana applications, transferring assets, trading, or using other network services.
🚨 More and More Users Are Showing Up Across Solana’s Network 📈 Solana’s network growth has jumped 124% since early September. Around 1.71M new wallets are now being created daily, showing that fresh users are entering the ecosystem at a much faster pace. 👥 Daily active addresses have climbed 58% over the same stretch, reaching roughly 4.27M unique wallets interacting with the network. More wallets are joining. More wallets are actually using Solana. ☀️ That creates a strong long-term bullish argument for SOL. Networks that attract more users and real utility have historically had greater potential to support higher market caps over time. If Solana keeps expanding its active user base, rising network value can eventually follow. 🔗 Live Solana Chart: https://t.co/9kMsX8bt1j
— Santiment Intelligence (@SantimentData) October 7, 2026
Santiment sees that as a constructive long-term signal for SOL.
If Solana continues adding active users at this pace, the network could support a higher valuation over time through greater utility and demand.
SOL Price Has Already Responded to Improving Network Trends
The timing of the network expansion lines up with a strong move in SOL.
At the beginning of September, Solana was trading near the $100 region.
The price later moved above $120, reaching roughly $124 before entering the current consolidation.
The price chart shows that SOL remains well above its August levels even after the latest pullback.
That means the broader structure is still much stronger than it was several weeks ago.
However, buyers have struggled to push through the $120-$124 region decisively.
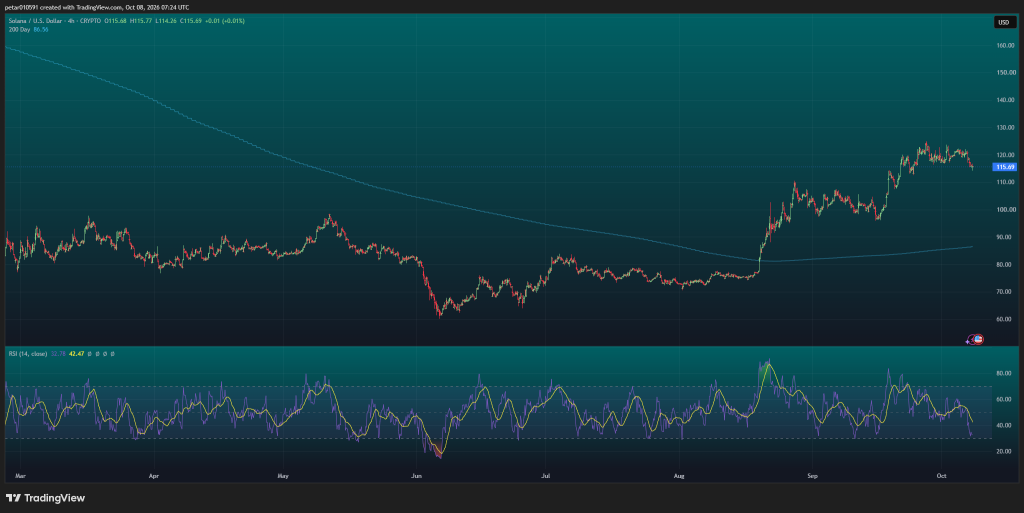
SOL has tested that area several times and has repeatedly met selling pressure.
SOL Price Support and Resistance
The immediate support iis around $114-$115, close to the current price.
If buyers defend that area, SOL could attempt another move toward $120.
Above $120, the main resistance is around $123-$125.
A sustained move beyond that region could open the path toward $130.
On the downside, losing $114 would bring the $110 area into focus.
Below that, the next stronger support zone appears around $103-$105, where SOL consolidated during September.
The broader technical structure remains constructive as long as price stays comfortably above the $100 area.
RSI Shows Short-Term Weakness
The four-hour RSI is currently near 32.8.
That puts SOL close to traditional oversold territory around 30.
The RSI moving average is higher near 42.5, showing that momentum has weakened quickly during the latest pullback.
This can create conditions for a short-term recovery if buyers step in around $114-$115.
But RSI alone does not confirm that a reversal has started.
The more useful signal would be SOL holding support and RSI turning back toward 40-50.
The 200-Day Average Remains Far Below Price
One of the more constructive parts of the chart is Solana’s position relative to its 200-day moving average.
The indicator is near $86.50, far below the current price.
SOL moved above this average in August and has remained comfortably above it since.
That keeps the broader trend positive even as short-term momentum cools.
A decline toward $110 or even $105 would therefore still leave SOL well above the longer-term average.
Solana Price Outlook
Santiment’s data gives SOL a strong fundamental backdrop.
Network growth is up 124%, daily active addresses are up 58%, and more than 1.7 million new wallets are appearing each day.
The price chart, however, shows that SOL still needs to clear the $120-$125 resistance zone before another larger move can develop.
For now, $114-$115 is the first level to watch.
If that zone holds, another test of $120 and $124 is possible.
If it fails, $110 becomes the next likely area, followed by $103-$105.
The interesting part is that network activity continues moving higher even as SOL cools from its recent highs.
For more crypto news and price predictions, click here.
Subscribe to our YouTube channel for daily crypto updates, market insights, and expert analysis.