Solana price is once again testing a level that has defined its entire story so far, its five-year ascending trendline. This line has acted as Solana’s backbone through wild bull markets, painful crashes, and everything in between.
And now that SOL is back at it again, analysts like Batman think the odds of a bottom forming here are much higher than a new top.
Let’s take a step back. Solana’s weekly chart shows one of the most consistent long-term patterns in the crypto market. Since early 2020, the same rising support line has carried SOL from just a few dollars all the way into triple digits.
Every time Solana has dropped to this trendline, whether it was during the brutal 2022 crash, the FTX meltdown, or the early 2024 retrace, buyers have stepped in hard. It’s not a coincidence. This is where long-term holders and institutional traders see value.
Now, we’re back there again. Historically, each retest of this trendline has been followed by massive rallies, often doubling or tripling in price in the months that followed.
What you'll learn 👉
What the SOL Chart Is Saying Right Now
Solana price is trading around $180, hovering directly above that long-term ascending support zone between $165 and $175. The trendline has held for nearly five years and aligns with a clear horizontal support zone from previous market cycles.
That confluence, both diagonal and horizontal support, makes this level extremely important. If SOL can hold here and form a clean bounce, it could mark the end of its correction phase and the start of another upward leg.,
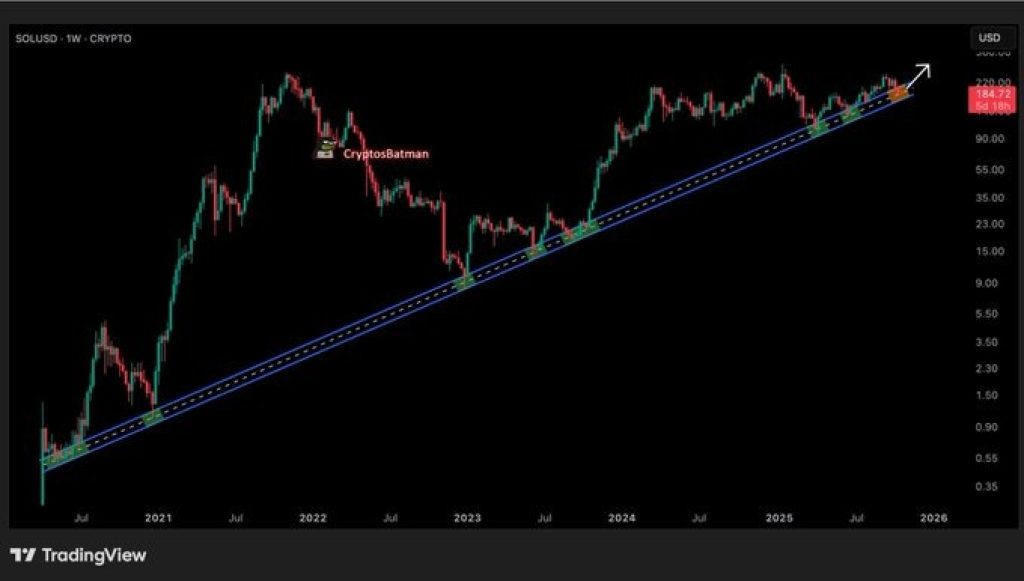
Even a small move off this trendline historically turns into something much bigger once momentum builds. The structure suggests that as long as SOL doesn’t close multiple weekly candles below $160, the long-term uptrend remains completely intact.
Why This Looks More Like a Bottom Than a Top
Batman summed it up best: when Solana is sitting at this trendline, “a bottom is far more likely than a cycle top.”
And that’s easy to see when you zoom out. During each previous touch, the broader market sentiment was usually negative, traders were cautious, headlines were bearish, and fear dominated social media. Yet, those moments turned out to be perfect accumulation zones for patient investors.
This time, things feel very similar. The market’s been cooling off, altcoins are consolidating, and hype has moved elsewhere.
But Solana’s fundamentals are stronger than ever, daily active users remain near all-time highs, on-chain activity is thriving, and the ecosystem continues to expand into DeFi, NFTs, and payments.
So even though the price might look stagnant, the foundation underneath is anything but weak.
Read Also: Kaspa Accumulation Surges as Whales Take Control – Here’s How KAS Price Could React
Solana Price Key Levels to Watch
If SOL price can stay above $175, the first resistance zone is in the neighborhood of $220–$250, which capped the recent rallies. A weekly close there would most likely lead the way towards $300, and beyond that, Solana can revisit 2021 highs around $400.
If the market does collapse, however, and SOL loses its trendline for the first time since 2020, a more widespread correction to $130 may be seen before the next bounce. But following the long-term chart setup and volume action, that is still less likely.
The Bigger Picture
Solana has managed to stay relevant and dominant through every phase of the crypto cycle, and this 5-year trendline is the proof. It’s rare to see a layer-1 coin maintain such technical consistency for so long.
This retest might not feel exciting in the short term, but historically, these quiet moments near strong support have been the best times to pay attention.
As Batman hinted, this could be the start of another major leg up, not the end of one for SOL price.
If the trendline holds once again, Solana price might be gearing up for its next big breakout, and history suggests that when it does, it doesn’t just bounce. It runs.
Subscribe to our YouTube channel for daily crypto updates, market insights, and expert analysis.