Solana’s current market trend exhibits a promising uptick, as noted by cryptocurrency analyst Altcoin Sherpa. With the price hovering around $167, at press time, the recent consolidation phase may have set the stage for further gains. According to Altcoin Sherpa, the consolidation period lasting a month was beneficial, creating an optimal environment for accumulation between the $120-$150 range.
What you'll learn 👉
Solana’s Technical Analysis
Support and Resistance Levels
Solana’s daily price chart reveals critical technical details crucial for potential investors. The identified support level at approximately $115-$117 acts as a strong foundation, where the price has consistently found a floor and rebounded. On the upper side, resistance near $210 delineates the threshold where upward price movement meets selling pressure. This range defines the current trading boundaries for Solana, guiding traders on potential breakout or breakdown points.
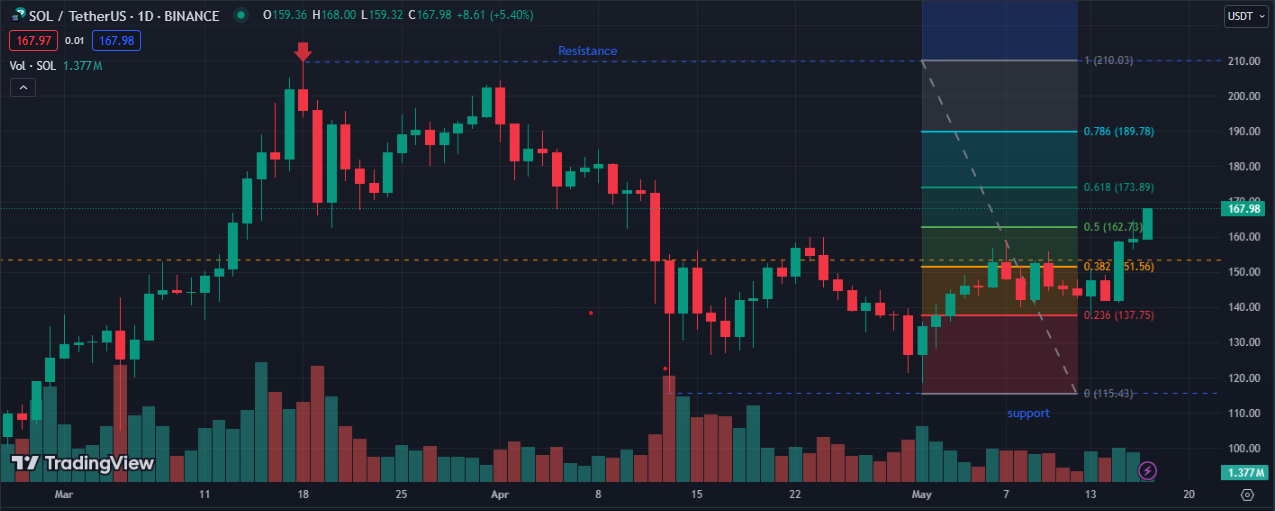
Traders often utilize Fibonacci retracement levels to identify possible reversal points. For Solana, the 0.236 Fibonacci level at about $137.75 and the 0.382 level at $151.56 represent critical junctures. At publication, the price at $167.98 trends upward toward the resistance at $173.89, an area that could dictate the short-term market direction. A decisive break above this level might propel the price towards higher Fibonacci marks, particularly the 0.786 level at $189.7, offering substantial opportunities for gains.
Doge2014 raises 500K in days celebrating Dogecoin. Make potentially big profits and get in on exclusive airdrop!
Show more +Read also: Will SOL Price Pump Lead to a New Solana Meme Coin Rally?
Volume and Indicator Analysis
Recent trading volumes and indicator readings provide a comprehensive view of market sentiment. An increase in volume, especially on up days, underscores the strength behind price movements. The Relative Strength Index (RSI), now at 62.29, indicates that Solana is nearing overbought territory but has not yet reached a tipping point.
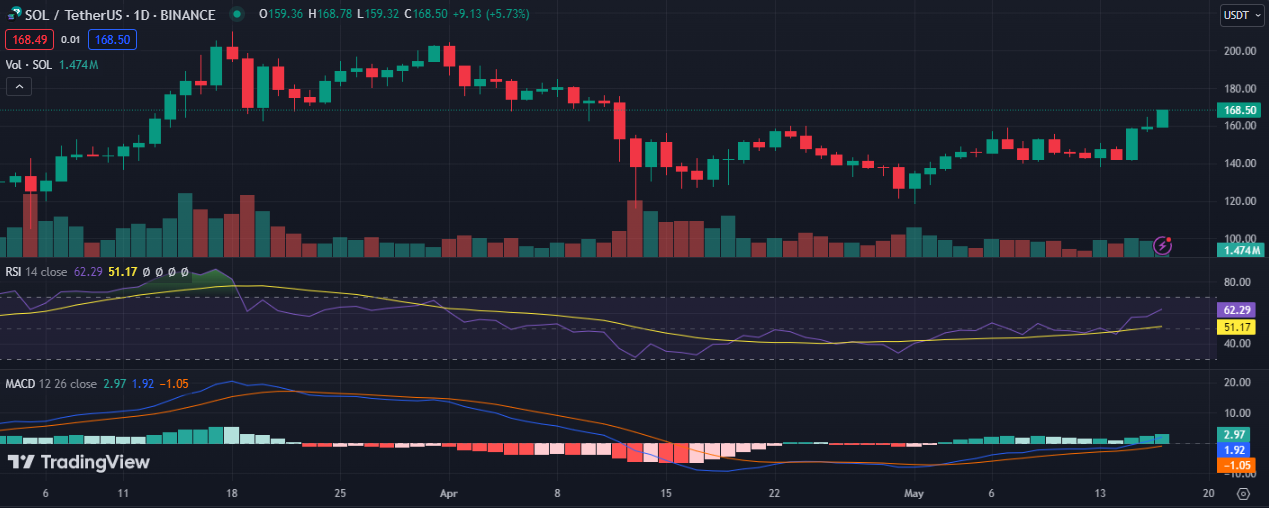
Meanwhile, the Moving Average Convergence Divergence (MACD) shows a bullish signal, with the MACD line above the signal line. These indicators suggest ongoing buying momentum, albeit with caution advised as the asset approaches potentially overbought conditions.
Market Implications and Predicted Movements
Short-term predictions remain bullish for Solana, propelled by increased trading volume and positive technical indicators. Challenges could arise if the RSI reaches overbought territory, potentially leading to a price pullback. However, if Solana breaks above the current resistance with significant volume, it could ascend towards higher Fibonacci levels, particularly $189.78.
Hunting for a small cap coin that could explode 10x? We’ve unveiled a few last week alone.
Get all our future calls by joining our FREE Telegram community.

We recommend eToro
Wide range of assets: cryptocurrencies alongside other investment products such as stocks and ETFs.
Copy trading: allows users to copy the trades of leading traders, for free.
User-friendly: eToro’s web-based platform and mobile app are user-friendly and easy to navigate.