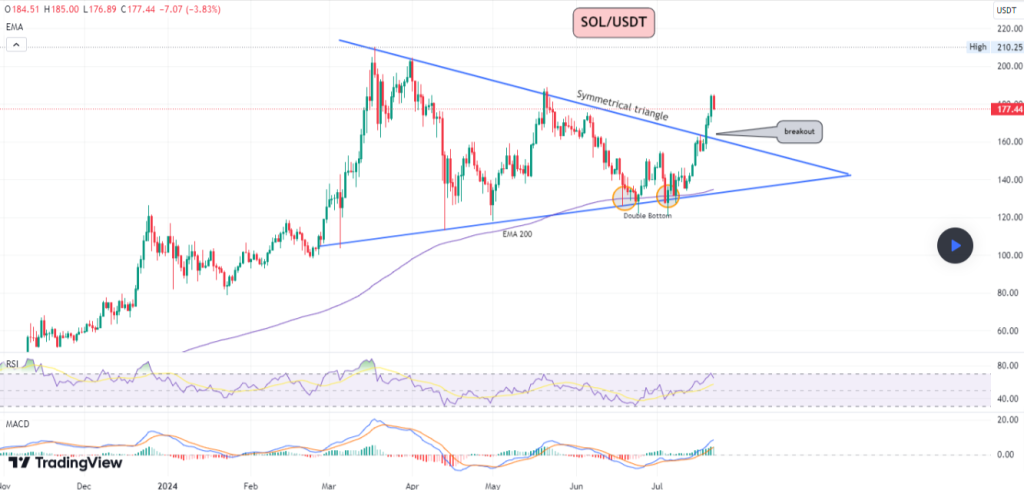
Mudrex, a crypto analyst, posted an analysis on TradingView about Solana’s price trajectory. Based on his post, Solana has been impressive, with returns yielding 16.2%.
The analyst said Solana’s performance stands out even among the top market-cap giants. The market sentiment towards Solana and its associated tokens, including SOL-based meme coins, remains highly bullish.
This bullish sentiment has propelled the prices of key Solana ecosystem coins like Jupiter, Raydium, and Ponke.

On the technical front, SOL has been forming a large symmetrical triangle on the daily timeframe. Within this pattern, a double-bottom formation has emerged, signaling a bullish breakout.
As expected, SOL experienced a substantial rally, climbing from $135 to $185. After retesting $172, SOL is now challenging the $185 level once again. The next significant target is $200, with the potential to revisit this year’s all-time high of $210.
Further analysis reveals that the daily MACD (levels 12, 26) is turning bullish, currently valued at 8.50. The RSI stands at 65.71, indicating there is still room for upward movement. Additionally, Solana has respected the 200 EMA, providing further hope for continued bullish momentum.
These major indicators suggest continued bullish momentum, reinforcing the potential for further gains in the near term.
Doge2014 raises 500K in days celebrating Dogecoin. Make potentially big profits and get in on exclusive airdrop!
Show more +Read Also: Non-Playable Coin Meme Token Price Soars: Will NPC Flip SHIB, DOGE, and WIF?
AltFINS Also Projects Bullish Move
Apart from Mudrex, AltFINS, a crypto analytics firm, posted a technical analysis that shows that Solana
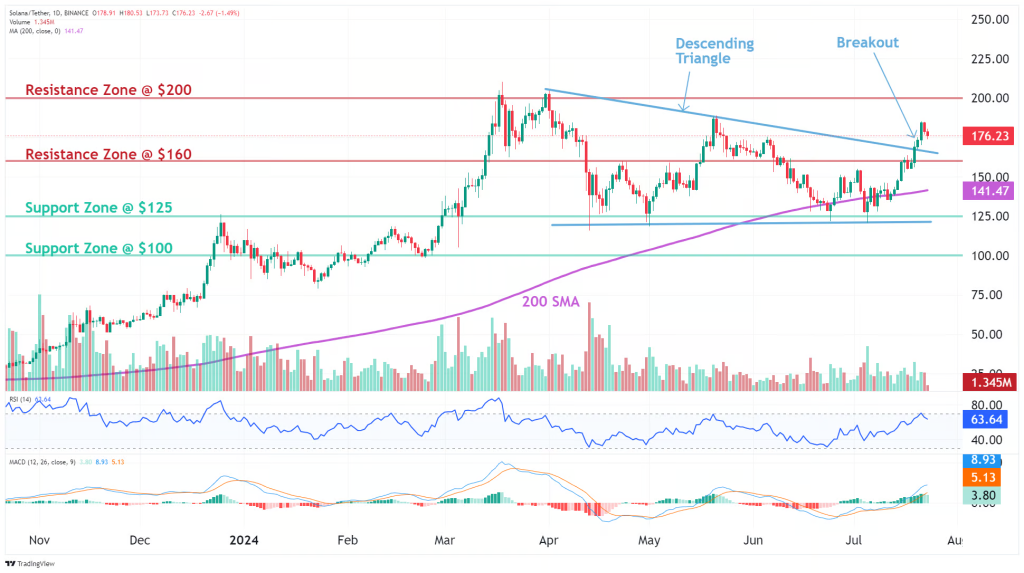
Based on their analysis, the price regained the 200-day moving average, which is a signal that the path is bullish in the long term. The bullish breakout from a descending triangle above the $160 could be followed by an uptrend to $200. The analysis suggests placing a stop-loss at $154 for those who would love to take trades after the breakout.
The analytics firms stated:
“Price is trading in a Descending Triangle pattern. Typically, a breakout will occur in the direction of the existing trend. Most traders will take a position once the price action breaks through the bottom line of the triangle with increased volume, which is when the price should decline an amount equivalent to the widest section of the triangle.”

Source: altFINS – Start using it today
Based on the analysis, the short-term and medium-term trends are strong, while the long-term trend remains neutral.
The momentum is bullish but inflecting with the MACD line above the signal line. However, a declining MACD histogram could be a signal that momentum is declining and the price is nearing a downswing.
If the price is able to break above the descending channel, then we could see an upswing to $200. However, a decline could see a dip back to $125.00, then $100.00.
Subscribe to our YouTube channel for daily crypto updates, market insights, and expert analysis.
We recommend eToro
Wide range of assets: cryptocurrencies alongside other investment products such as stocks and ETFs.
Copy trading: allows users to copy the trades of leading traders, for free.
User-friendly: eToro’s web-based platform and mobile app are user-friendly and easy to navigate.


