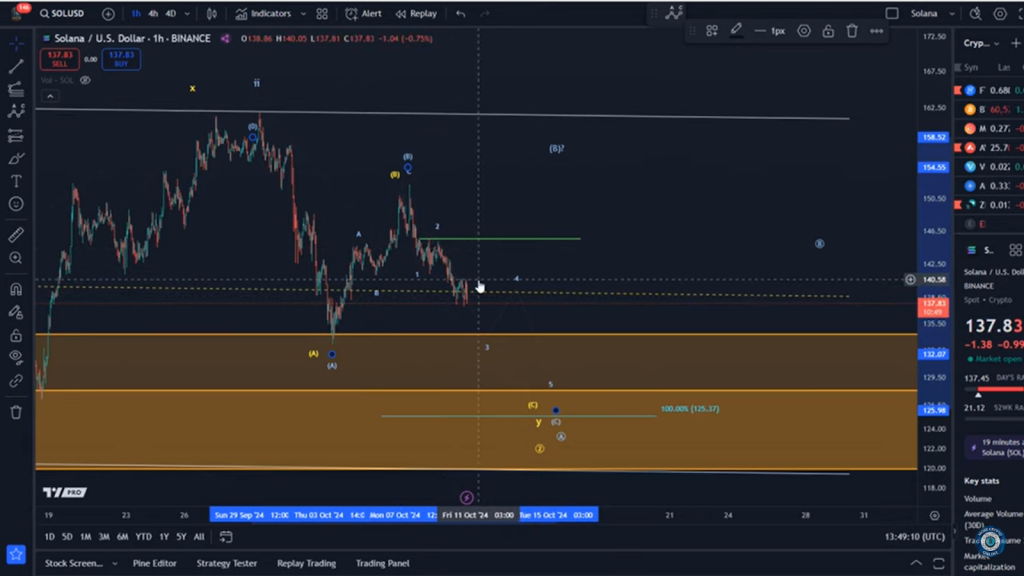
In a video update by MoreCryptoOnline, an analysis of Solana’s Elliott Wave structure sheds light on potential price scenarios. The analyst offers insights into bullish and bearish possibilities, while also emphasizing key support and resistance levels.
According to the analysis, Solana’s current movement suggests that the asset is possibly in a complex WXY correction within wave two. The speaker notes that Solana’s price support zone is between $119 and $134, which has held so far.
This pattern indicates the possibility of an upward price movement if Solana maintains this support. The bullish count is framed around a larger degree wave four bottoming in August, followed by a wave one rally into the early August highs.
MoreCryptoOnline also highlights that while Solana’s price has remained above its support levels, the lack of impulsive movement from the September low suggests the correction may still be ongoing.
Investors are advised to keep an eye on whether Solana’s price can break out into a third-wave rally once the WXY structure concludes. The market remains uncertain until a clear impulsive move emerges from the current range.
Doge2014 raises 500K in days celebrating Dogecoin. Make potentially big profits and get in on exclusive airdrop!
Show more +What you'll learn 👉
Bearish Scenario: Skepticism Around the Downside
The bearish scenario, labeled as the blue count, presents a more cautious outlook. In this count, Solana’s price would need to break below the $119 support level for a downward move to be confirmed.
The analyst discusses the formation of a diagonal pattern within wave three, which would indicate a further decline. However, diagonal patterns are known to lack follow-through, leading to skepticism about the reliability of this scenario.
For this bearish outlook to fully unfold, a break below the lower boundary of the trend channel would be necessary. Until then, the market is seen as moving within a range, with no definitive direction yet determined.
Read Also: Fantom Bulls Are Failing, Here’s Why FTM Price Might Be in a Bull Trap
Current Price Movements: Local Trends and Support Levels
In the short term, Solana’s local trend appears to be leaning downward. The speaker points out that the recent decline from the September 29 high could potentially be the beginning of an A wave within the broader Y wave in the bullish count.
Alternatively, this could align with the bearish wave three scenarios. In either case, the next major support level is expected around $125.37, based on Fibonacci extension targets.

The speaker advises investors to watch for a break below the October 3 low to confirm further downside movement. Conversely, a move above the green signal line could indicate that the current structure is morphing, delaying the expected sell-off.
Finally, the bullish and bearish scenarios for Solana’s price remain viable, as the asset continues to trade within a well-defined range. With key support levels holding and no clear impulsive move to the upside or downside, the market has yet to make a decisive commitment. Investors should monitor Solana closely for any significant price movements that could provide further clarity on the direction of the next major wave.
Subscribe to our YouTube channel for daily crypto updates, market insights, and expert analysis.
We recommend eToro
Wide range of assets: cryptocurrencies alongside other investment products such as stocks and ETFs.
Copy trading: allows users to copy the trades of leading traders, for free.
User-friendly: eToro’s web-based platform and mobile app are user-friendly and easy to navigate.


