The silver price is at around $73. The metal has been choppy since its run above $100 earlier this year, leaving traders unsure of the next direction. But one analyst says the chart tells a clear story: the correction is almost over, and the next leg targets $150.
Economic Office, a chart-focused account on X, posted a 12‑hour silver chart with an Elliott wave breakdown. The analysis caught attention because it maps out a precise path higher.
The chart labels silver’s recent price action as a 4th phase correction following a strong 3rd wave rally. Corrections in Elliott wave theory often take the form of W‑X‑Y patterns—a three‑part move that zigzags sideways before the trend resums.
According to the chart:
- Wave W completed first, a downward move that started the correction.
- Wave X followed, a bounce that retraced part of the decline.
- Now Wave Y is in its final stage, the last push down before the correction ends.
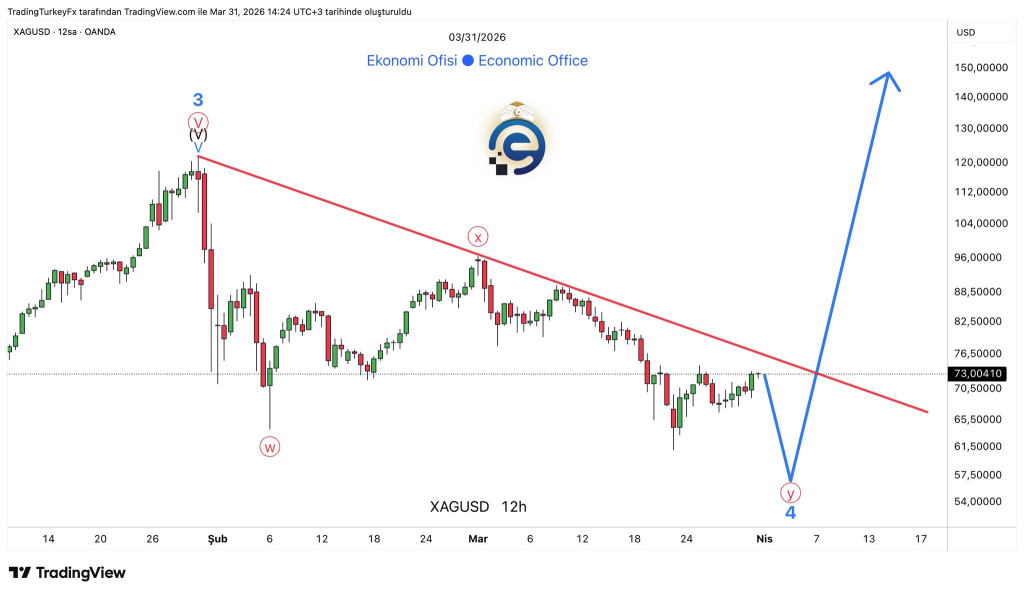
The analyst marked the current price near the bottom of that Y wave. Once the Y wave finishes, the 4th phase ends, and the 5th wave begins. The target for the 5th wave is $150.
That would represent a 105 percent move from current levels.
The 12‑hour chart displays silver trading around $73. The Y wave appears as a downward sloping structure, with price holding above the $70 support zone. The wave count indicates that once this final dip is complete, momentum will shift aggressively to the upside.
The $150 target is not pulled out of thin air. In Elliott wave theory, the 5th wave often reaches a length equal to the 1st wave or extends beyond. The previous 3rd wave ran from roughly $50 to $120, a $70 move. A similar 5th wave from a base near $70 would land at $140–$150.
Read also: Peter Schiff Updates His Gold Price Prediction for April
Our Take
Elliott wave analysis is one way to read markets, but it is not a crystal ball. The pattern looks clean on the 12‑hour chart, and the $70 level has held as support multiple times in recent weeks. That gives the bullish case credibility.
Still, a move to $150 requires more than just a wave count. Silver needs a catalyst; either a weaker dollar, a sudden supply shock, or a big pickup in industrial demand. The inventory drawdowns in London and Shanghai provide a fundamental tailwind. If the Fed signals rate cuts, the dollar could weaken further, adding fuel.
The more conservative view would be to watch $70 closely. If silver breaks below that level, the Y wave could extend deeper, invalidating the bullish count. If the silver price holds and starts climbing above $75, the path to $150 becomes a real possibility.
Subscribe to our YouTube channel for daily crypto updates, market insights, and expert analysis.