Silver has returned to a familiar support area after a deep retreat from its earlier peak. Stefano Bottaioli believes the latest technical setup deserves a closer look because similar conditions appeared before major recoveries.
His silver price prediction centers on a pattern beneath the main price chart. That pattern offers a possible recovery clue, but the size and timing of previous rebounds explain why the latest opportunity needs careful interpretation.
What you'll learn 👉
Silver Price Chart Shows a Rare Oversold Setup Below the 200-Day EMA
A look at the silver chart shows the metal near $56.77 after a prolonged decline from its January peak around $121. The upper panel tracks silver’s daily price, and the lower panel measures its percentage distance from the 200 day exponential moving average.
That moving average provides a reference for the broader trend. Silver trading beneath it produces a negative deviation reading. A larger negative reading means the price has fallen further below that reference.
Bottaioli identifies a double bottom around 13% to 15% below the average. The red circle at the lower right marks the latest cluster of extreme readings, close to the horizontal threshold associated with earlier lows.
Historic technical setup unfolding on $SILVER The distance from the 200-day EMA has just printed a textbook double bottom at extreme oversold levels (around -13% / -15%). The only two historical precedents over the last 6 years: • March 2020: sparked a +160.6% surge • July–Oct 2022: ignited a +540.1% mega-rally The coil is fully loaded at the identical deviation threshold. Asymmetric risk/reward for the next leg up. Don’t fade the mean-reversion.
— Stefano Bottaioli (@stebottaioli) October 15, 2026
The important detail is that this double bottom appears in the deviation indicator. Silver’s price still needs to establish its own recovery structure through stronger rebounds and support that holds after pullbacks.
The enlarged panels on the right provide a closer view of the latest decline and indicator fluctuations. They show how silver returned to an unusually stretched position after its earlier rebound attempts failed to sustain the recovery.
Bottaioli’s Historical Comparisons Cover Extended Silver Price Rallies
Bottaioli points to March 2020 and the July through October 2022 period as earlier examples of comparable oversold conditions. His chart marks subsequent advances of approximately 160.6% and 540.1%.
The measurement periods matter as much as those percentages. The first annotation connects the 2020 low with the later recovery peak. The larger measurement extends from the 2022 bottom toward the January 2026 peak.
These were extended advances across different market conditions, not immediate jumps after an indicator touched an oversold threshold.
The chart supports several useful observations:
- The March 2020 extreme preceded a strong recovery into 2021.
- The 2022 extreme came before a much longer advance toward the 2026 peak.
- The latest indicator readings have returned near those earlier oversold areas.
Bottaioli’s argument rests on mean reversion, which describes the gap between price and its average becoming smaller. That can happen through a price recovery, a declining moving average, or a combination of both.
Consequently, the historical setup supports a possible rebound without establishing a reliable percentage target. These selected examples also provide too little evidence to calculate the probability of another comparable rally.
Silver Price Support Around $55 Has Repeatedly Produced Recoveries
The more immediate silver price question concerns support around $55. The latest price near $56.77 places the metal just above that area after another test.
The supplied price sequence describes several recoveries from approximately the same zone. Silver rebounded during December 2025 before reaching around $121 in January. A June recovery reached roughly $63, and another rebound around July initially reached $60 before extending toward $71.
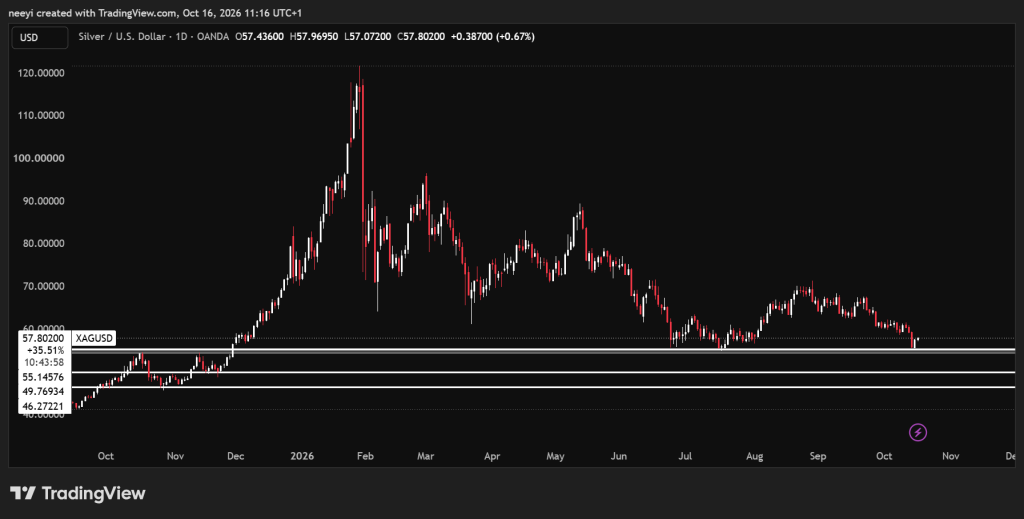
Those moves varied considerably in size. The December recovery developed into a much larger advance, but the later rebounds remained below the January peak.
That difference helps explain the current setup. Silver can produce another recovery from $55 without immediately reversing the entire decline.
Repeated visits also test the durability of support. Previous rebounds establish $55 as an important reference, but they cannot guarantee buyers will defend it indefinitely.
Silver Price Prediction Depends On Clearing $60 And $63
A sustained defense of $55 would preserve the immediate recovery case. The next useful checkpoints come from the earlier rebound levels described above.
- Silver price strength above $60 would clear an initial recovery reference.
- A sustained move through $63 would improve the case for further upside.
- A later test near $71 would challenge the previous larger rebound.
Read Also: Ripple’s Latest Banking Deal Has an Elon Musk X Money Connection
Successful retests would carry more weight than brief moves above those levels. Silver also needs to avoid repeatedly returning to support after each recovery attempt.
A sustained break below $55 would weaken the bullish setup and leave the oversold indicator insufficient as a recovery argument.
Bottaioli’s historical comparison gives this rebound an interesting backdrop, but price confirmation remains essential. The next test is whether silver can turn another familiar bounce into a recovery that survives its first major resistance levels.
FAQs
Subscribe to our YouTube channel for daily crypto updates, market insights, and expert analysis.