Silver caught the interest of traders after a sharp decline from the January highs near $120, silver fell more than 40% to test a critical support level. The weekly chart shows a long wick touching the $70 zone, a level that has acted as a magnet for price and a potential turning point.
Dr. Potassium shared the move on X, noting the wick at major support. His message to traders is clear. This is not the time to be fearful. It is the time to stay resolved in your convictions. The inflation trade will resume in time, but these markets are too schizophrenic for most investors to stay focused.
What you'll learn 👉
Silver Weekly Chart Reveals the Setup
Looking at the weekly chart shared by Potassium, the structure becomes clear. Silver has been on quite a journey since its 2020 lows around $11.50. It climbed steadily over the years, through the 2021 peak near $30, a big breakout above $40 in 2024, and then an absolutely explosive run in 2025 that sent prices to all-time highs above $120. By any measure, it’s been a historic ride for the precious metal.
But what goes up fast can come down fast too. The pullback from those highs has been pretty painful, silver shed more than 40% in just a matter of weeks, dropping all the way down to around $70.
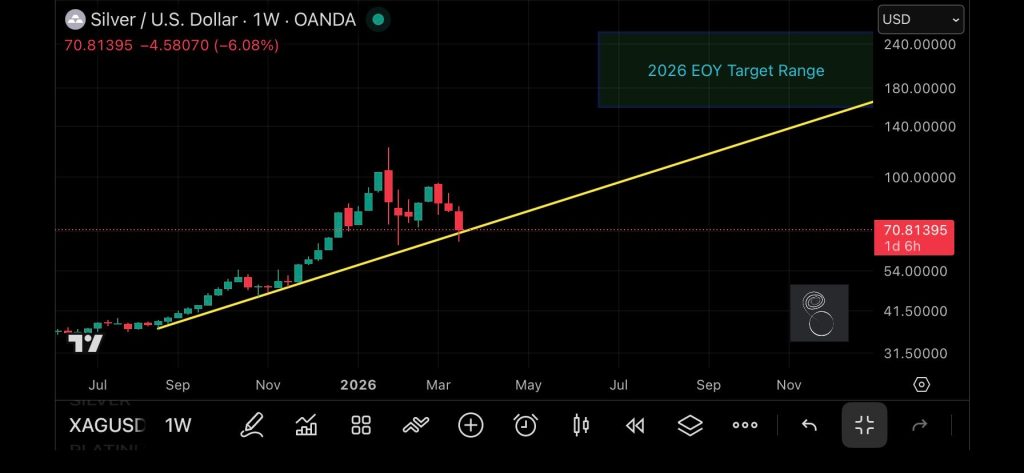
The silver lining, if you will, is that buyers showed up at that level. You can see it clearly on the weekly chart, that long wick tells you sellers tried to push it lower, but buyers pushed back and reclaimed some ground before the week was out.
This type of price action is significant. A wick at major support indicates that sellers were unable to hold price at the lows and that buyers found value in that zone. It does not guarantee a bottom, but it indicates that the level is being defended.
The $70 Support Level
The $70 zone is not arbitrary. It represents a previous area of consolidation from mid-2025, where the silver price spent several weeks building a base before the final leg higher to $120. Levels where price previously consolidated often act as support during pullbacks, as traders who missed the first move look for entries.
Dr. Potassium identifies this as major support, and the wick confirms that buyers are present. Whether this turns out to be the final bottom really comes down to one thing, can silver hold this level and start building upward momentum from here?
Looking further out, the chart points to a pretty interesting target range for the end of 2026, somewhere between $140 and $180. That lines up with the bigger picture view that the inflation trade isn’t dead, it’s just taking a breather. Once the current volatility settles down, the thinking is that silver picks up where it left off and resumes its long-term climb.
Why This Pullback Is Different
The sharpness of the decline has shaken many investors. A 40% drop in weeks is the kind of move that tests conviction and forces weak hands to exit. Dr. Potassium addresses this directly. This is not the time to be fearful. It is the time to stay resolved.
The argument rests on the fundamental backdrop. Inflation concerns have not disappeared. Central bank policies remain accommodative relative to history. Geopolitical tensions continue to support safe-haven demand. The factors that drove silver to $120 have not reversed. They have simply been overshadowed by short-term volatility.
As Dr. Potassium puts it, markets are basically schizophrenic. One minute they’re riding high on optimism, the next they’re in full panic mode, and none of it has much to do with the actual fundamentals. But for investors who can see past the noise and keep the bigger picture in mind, that kind of wild swinging isn’t something to fear. It’s actually where the opportunity hides.
Read Also: Retail Investors Are Piling Into Gold and Silver While Institutions Quietly Exit – Here’s the Data
What Comes Next for the Silver Price
Silver is at a pretty critical moment right now. That wick down at $70 indicates support is holding, but we really need to see some follow-through before calling it confirmed.
A bounce up toward $80 to $85 would be the first encouraging sign that buyers are starting to take back control. A push back above $100 would be even better, that’s the level that would really signal the correction is done and the uptrend is back on track.
On the downside, if $70 doesn’t hold, the next area to watch is somewhere between $60 and $65, with longer-term support sitting around $50. A drop that deep would mean silver has given back roughly half of its entire rally from the highs, which sounds scary, but honestly, for a metal as volatile as silver, it wouldn’t be the first time that’s happened.
Subscribe to our YouTube channel for daily crypto updates, market insights, and expert analysis.