Silver is back above $70, and the mood around the metal could not be more different than it was just a few weeks ago.
That contrast is exactly what analyst Otavio Costa showed in a recent post on X. His point wasn’t about silver hitting a magical number. It was about what the market looks like underneath the surface when price revisits the same zone.
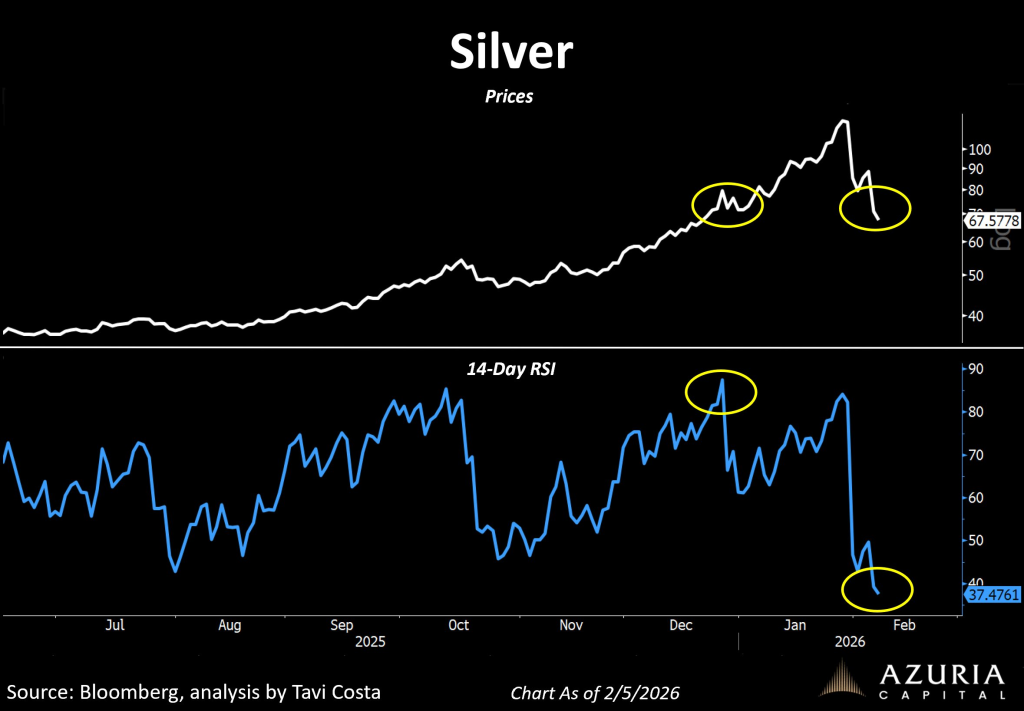
In mid-December, silver was trading near $65 and sentiment was almost euphoric. Momentum was strong, buyers were aggressive, and the technicals reflected it. Costa notes that the 14-day RSI at the time was pushing close to 80, which is typically considered an overheated level.
Fast forward to today, and the silver price is back in the same neighborhood, now slightly above $70. But the RSI picture has completely flipped. Instead of sitting near overbought territory, the 14-day RSI has collapsed closer to the low-30s.
Same metal. Similar price. Totally different emotional backdrop.
Costa summed it up with a Buffett-style reminder: “Be greedy when others are fearful.”
What you'll learn 👉
Why the RSI Shift Matters
The chart Costa shared makes the divergence obvious. In December, silver reached this zone after a sharp run higher. RSI was elevated because momentum was strong and traders were chasing upside.
This time, silver has returned to the area after a brutal reset. The RSI has been crushed, which suggests the move has been driven more by fear, forced selling, and exhaustion than by bullish acceleration.
That difference matters.
When price revisits a level with much weaker momentum, it often signals that positioning has changed. The crowd isn’t leaning the same way. The market isn’t chasing. It’s hesitating, panicking, or simply trying to survive the volatility.
Euphoria in December. Panic now.
Commodities Are Swinging Wildly Right Now
Silver’s price action also fits into a bigger theme playing out across commodities.
Moves of 15% to 20% have started happening like they’re nothing. Metals, energy, and other hard assets have been whipping around in ways that feel abnormal for markets that are supposed to trade on supply, demand, and macro fundamentals.
It’s the kind of volatility that makes traders question whether something deeper is going on.
When commodities start moving like meme coins, it usually points to structural stress:
Thin liquidity
Crowded leverage
Derivatives pushing spot prices
Stop cascades triggering fast drops
Large systematic flows hitting at once
To many observers, it looks like price is being pushed around, especially when physical markets don’t seem to match the chaos on futures screens.
Read also: If You Put $5,000 Into Silver Now, What Happens by 2027?
Is It Manipulation?
It’s tempting to call moves like this manipulation, and honestly, the action feels unnatural when silver can swing 20% in a short window.
But proving manipulation is difficult.
What’s more realistic is that the market structure itself creates these distortions. Paper volume dominates short-term pricing. Leverage amplifies every move. Once liquidation-style selling begins, price can overshoot dramatically even without any coordinated effort.
What can be said clearly is that silver has been trading in a disorderly environment, and disorderly markets tend to produce panic signals.
Silver Price: Key Levels to Watch From Here
With silver now back above $70, the market is sitting at a major psychological pivot.
$70 is the line traders will focus on first. If it holds, it reinforces the idea that this selloff may be exhausting.
Below that, the $65 zone is the fear retest level Costa referenced. If silver slips back there, it becomes the next major support area.
On the upside, silver will face heavy pressure in the mid-$70s and into the $80 region, where previous supply zones sit.
The bigger question is whether momentum stabilizes after this flush, or whether volatility continues shaking out both bulls and bears.
Subscribe to our YouTube channel for daily crypto updates, market insights, and expert analysis.