Short Traders Could Be in Trouble if Kaspa (KAS) Price Breaks This Level – Here’s What the Charts Reveal

Kaspa price is sitting just under $0.09 after a recent pullback, but the charts are hinting at a setup that could spell trouble for short traders.
According to Kaspa Daily, nearly $30M in short positions could be liquidated if price climbs to $0.10, which might trigger forced buying and add sharp volatility.
Nearly $30M worth of short positions stand to be liquidated if Kaspa price climbs to $0.10, according to liquidation data.
— Kaspa Daily (@DailyKaspa) August 12, 2025
A move to this level could trigger a wave of forced buying, potentially adding to volatility. pic.twitter.com/n4Jd4ZtUFJ
Kaspa Daily also notes that liquidity maps show a large cluster between $0.086 and $0.081, and another one above in the $0.096–$0.10 range. These areas could act as key magnets for price movement in the short term.
Kaspa is trading just under $0.09 following the recent correction.
— Kaspa Daily (@DailyKaspa) August 12, 2025
Liquidity maps show a notable cluster below between $0.086 and $0.081, while another significant cluster sits above in the $0.096–$0.10 range.
These areas could act as key magnets for price movement in the… pic.twitter.com/9jqIZG347N
What the KAS Chart Shows
On the 4H chart, KAS price is still making lower highs under a long descending trendline that’s been in play since late 2024.
That trendline is now sitting around $0.11–$0.115. After breaking support at $0.083 in June, bulls managed a strong rebound to $0.12, but price has since pulled back.
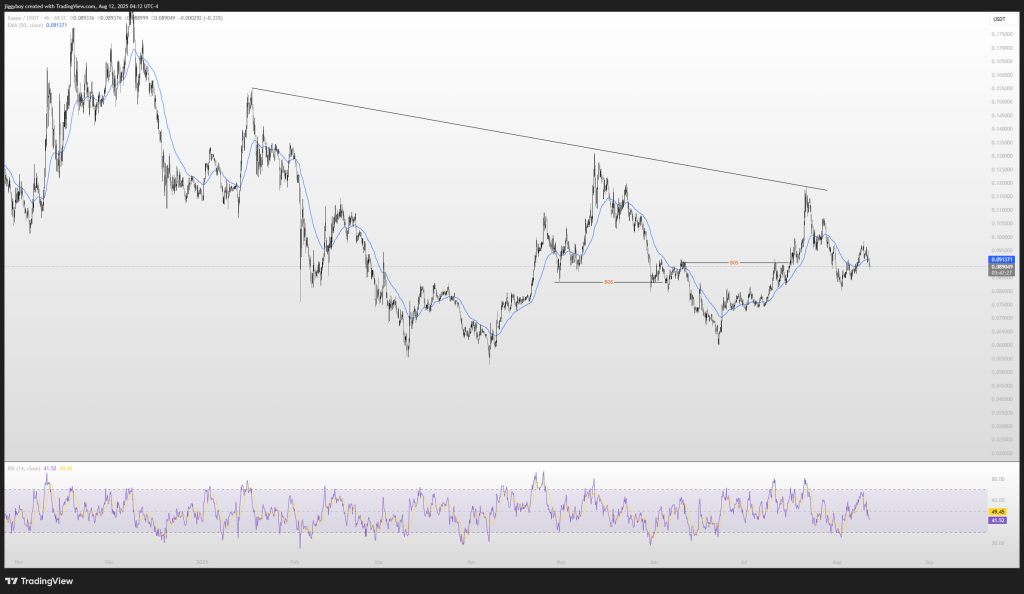
The 50-EMA on the 4-hour chart is now near $0.093 and acting as resistance. The RSI is in the low 40s, showing momentum has cooled but isn’t oversold yet.
If KAS price holds above $0.086 and breaks over $0.093, it could move toward $0.096. Clearing $0.096 would open the door to a $0.10 test, where short positions could get squeezed.
Read Also: Why the XRP Price Potential May Not Be Limited by Traditional Market Cap Logic
Kaspa Price Levels to Watch
If buyers can reclaim $0.093 and push through $0.096, the path to $0.10 becomes much easier. That’s where shorts face the most pressure. But if the price dips below $0.086, it can go down to $0.083 and even $0.081, where there is very high liquidity.
Now, the race is between resistance at $0.096–$0.10 and support at $0.086–$0.081. Whoever cracks first will likely set the direction for the next move.
In the end, the charts make the picture clear. If the Kaspa price can reclaim $0.093 and push through $0.096, the path to $0.10 is wide open, and that’s where shorts could start feeling the heat.
But if it slips under $0.086, the lower liquidity zones could pull the price down fast. Right now, all eyes are on these key levels to see which side of the market blinks first.
Subscribe to our YouTube channel for daily crypto updates, market insights, and expert analysis.