Cryptocurrency trader Ali has shared a potentially bullish development for Shiba Inu (SHIB). According to Ali, the TD Sequential indicator is presenting buy signals on SHIB’s daily chart, suggesting that a price rebound may be on the horizon for this altcoin. The tweet by Ali comes at a time when the meme coin sector is showing signs of reversal.
What you'll learn 👉
Technical Analysis Reveals Complex Market Structure
While the TD Sequential indicator points towards a potential bullish move, a detailed technical analysis by altFINS provides a more nuanced view of SHIB’s current market position.
The near-term outlook for SHIB is currently neutral, with the token showing signs of being oversold at a support level. This emerging pattern suggests that there’s a high probability of a price bounce in the near term, particularly when the Relative Strength Index (RSI) hits 30 or less.
- Short-term trend: Strong Down
- Medium-term trend: Strong Down
- Long-term trend: Neutral
This trend profile indicates major downward pressure in the short to medium term, while the long-term trajectory remains uncertain.

Source: altFINS – Start using it today
Critical Support Level Breach and Potential Recovery
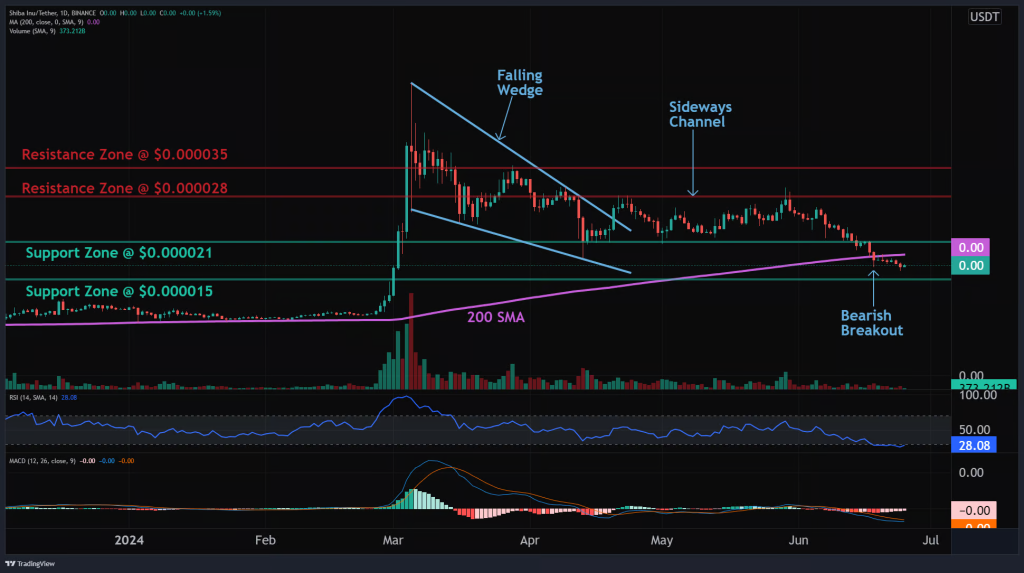
SHIB has recently broken below the $0.000021 support level and its 200-day moving average, signaling a downtrend. Traders are now waiting for the price to reclaim this critical level to indicate a resumption of the uptrend.
If SHIB manages to regain its footing above the critical support level, altFINS suggests an upside potential to the resistance level of $0.000028, representing a potential gain of 33%.
Despite the overall bearish trend, momentum indicators are showing signs of a potential turnaround:
- MACD Histogram: Rising, indicating that bearish momentum may be waning
- RSI-14: Currently neither overbought nor oversold, providing room for movement in either direction
Doge2014 raises 500K in days celebrating Dogecoin. Make potentially big profits and get in on exclusive airdrop!
Show more +Key Support and Resistance Levels to Watch
Traders and investors should keep an eye on the following key levels:
- Nearest Support Zone: $0.000015
- Nearest Resistance Zones: $0.000028, followed by $0.000035
The conflicting signals from various technical indicators and chart patterns highlight the complexity of SHIB’s current market position. While the oversold conditions at support and potential bullish momentum inflection suggest a possible rebound, the recent support breakout and downward trends in shorter timeframes urge caution.
Traders considering entering or adding to SHIB positions may want to wait for confirmation of a trend reversal, such as a decisive move above the 200-day moving average. Setting price alerts at key levels, particularly at $0.000028, can help traders stay informed of major price movements.
Read also: Ripple’s XRP Will Surpass Ethereum – Here Are 3 Reasons According to Crypto Analyst
Subscribe to our YouTube channel for daily crypto updates, market insights, and expert analysis.
We recommend eToro
Wide range of assets: cryptocurrencies alongside other investment products such as stocks and ETFs.
Copy trading: allows users to copy the trades of leading traders, for free.
User-friendly: eToro’s web-based platform and mobile app are user-friendly and easy to navigate.


