The SHIB price has been getting a lot of interest lately after a solid move higher, and some traders think this could be the start of something bigger.
World Of Charts recently identified a possible breakout setup for SHIB, saying that if it clears both the trendline and horizontal resistance, we could see a 50%+ rally. It’s an exciting idea, but taking a closer look at the bigger picture, the chart still has more layers to consider.
What you'll learn 👉
The Bigger Picture Still Leans Down
We took a step back and looked at the SHIB chart shared by World Of Charts from a broader perspective, and the overall trend hasn’t changed yet. Since mid-2025, the SHIB price has been locked inside a descending channel, consistently making lower highs and lower lows.
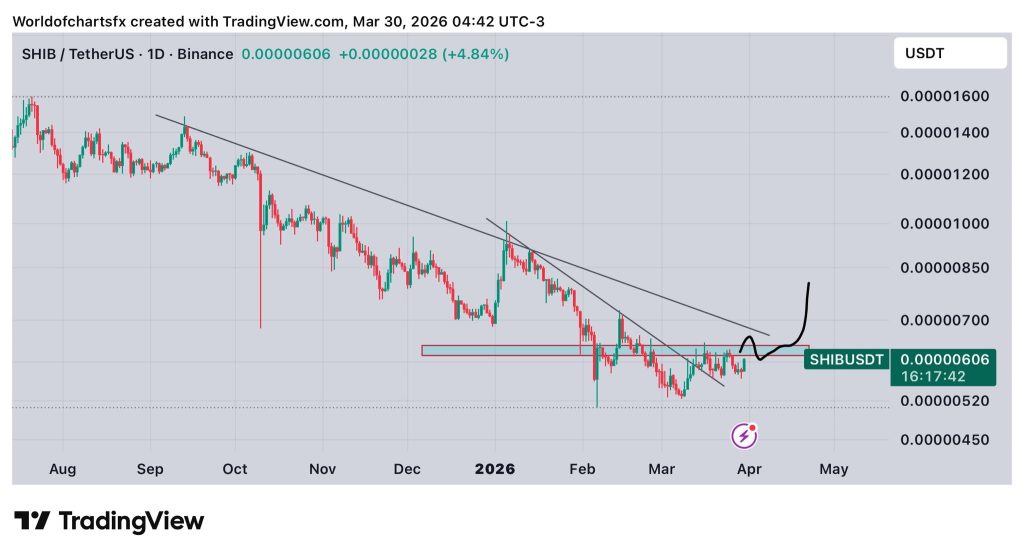
From its highs near $0.00001600 back in August 2025, the SHIB price has dropped more than 60%. That’s a prolonged downtrend, not a quick correction.
The channel structure is still clean and intact, with price respecting both the upper and lower boundaries multiple times. That’s important, because until that structure breaks, the trend remains in control.
A Key Support Zone Is Holding and a Break Could Change Everything for SHIB
The SHIB price is currently trading around $0.00000594, right at a crucial spot on the chart. This level lines up with the lower edge of the descending channel and a horizontal support zone between $0.00000520 and $0.00000606, making it a key area for buyers to step in.
That kind of confluence tends to attract buyers, and it already has. There was a sharp dip earlier this year that quickly got bought up, which shows there’s real demand in this range. The recent bounce, including a green daily candle, adds to the idea that this area is still being defended. But support alone isn’t enough to confirm anything yet.
If the SHIB price finally breaks above that descending trendline and manages to hold above it, that’s when things start to look different. That would be the first real sign that the downtrend is losing control.
That’s also where the more bullish scenarios come into play, including the kind of breakout move traders are talking about. But if the price gets rejected again, then nothing really changes. It simply becomes another bounce within the same downtrend.
The Setup for a Potential Move Higher for SHIB
There’s a clear idea forming on the chart. If the SHIB price continues to hold this support zone, it could push higher toward the top of the channel. That upper boundary is currently around $0.00000700 to $0.00000750.
A move into that range would already be a decent bounce from current levels. But the real focus is what happens when price gets there.
This trendline has rejected price multiple times before. Each rejection has led to another lower high, keeping the downtrend intact. That’s why this next test matters more than the previous ones.
Read Also: DeepSeek AI Predicts the Price of Zcash (ZEC) and Shiba Inu (SHIB) in April 2026
What to Watch Next
There’s also a lower support level around $0.00000520 acting as a fallback zone. If the current support breaks, that’s likely where price heads next before any recovery attempt.
Right now, the SHIB price is at a critical point. The setup for a move higher is there, and buyers are stepping in at support. But the overall trend hasn’t been broken yet.
The next few moves, especially how price reacts near that upper trendline, will be key. That’s the level that decides whether this turns into a real breakout—or just another temporary bounce.
Subscribe to our YouTube channel for daily crypto updates, market insights, and expert analysis.