Shiba Inu (SHIB) has seen some bullish price action recently, but momentum may be slowing based on key indicators like the MACD and RSI.
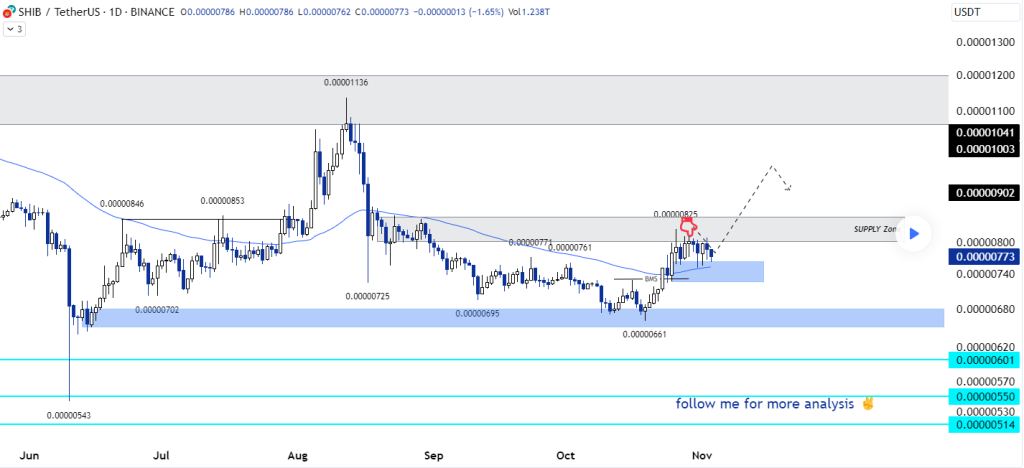
TradingView analyst SasanSeifi pointed out in his latest SHIB analysis that the price broke above resistance at $0.00000733 and moved into the supply zone, but has since encountered some selling pressure around $0.00000770. This suggests some range-bound consolidation is likely in the short term.
Seifi believes if SHIB can break above and consolidate over the $0.00000800 level, further upside towards his price targets is possible. Support to watch is around $0.00000740 and $0.00000670. A break below $0.00000670 could open up a correction.

Looking at momentum indicators, the MACD line remains above the signal line, which is bullish. However, the MACD histogram bars are declining, pointing to momentum weakening in the short term.
The RSI is currently around 76. An RSI above 70 is considered overbought territory, suggesting SHIB may be slightly overextended after its recent run higher. An RSI this high means further gains could be limited in the near term without a cooling off period.
Overall, the positive price action and bullish momentum suggests further gains are possible for SHIB if key resistance levels can be broken. But overbought RSI conditions and fading MACD momentum point to a potential pause or consolidation being likely before any significant additional upside. Traders should watch for a break above $0.00000800 or below $0.00000670 as potential signals for the next major move.
We recommend eToro
Wide range of assets: cryptocurrencies alongside other investment products such as stocks and ETFs.
Copy trading: allows users to copy the trades of leading traders, for free.
User-friendly: eToro’s web-based platform and mobile app are user-friendly and easy to navigate.


