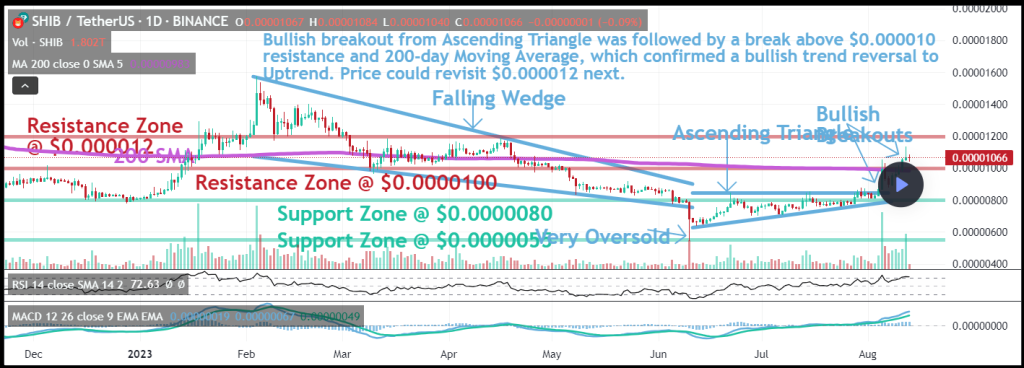
In a recent technical analysis of altFINS, Shiba Inu (SHIB) has shown promising signs of a bullish trend reversal. The popular meme cryptocurrency has been spotlighted for its recent breakout from an Ascending Triangle pattern, a well-regarded continuation pattern in technical analysis.
What you'll learn 👉
Bullish Breakout Confirmed
The Ascending Triangle, typically recognized as a continuation pattern, suggests that the asset will likely break out toward the existing trend. In the case of SHIB, this breakout was notably bullish. The breakout was further solidified when the price surpassed the $0.000010 resistance level and the 200-day Moving Average. Both these indicators are often used by traders to confirm trend reversals, and in this instance, they have indicated a shift to an uptrend for SHIB.

While most traders typically wait for a breakout from such patterns, swing traders can trade between the trendlines. This strategy involves buying at the support levels and selling at resistance, especially when the trendlines are relatively distant. It’s a tactic that can yield significant returns, especially in volatile markets.
Trend Analysis
On a short- and medium-term basis, SHIB is now in an uptrend. However, it’s essential to note that on a long-term basis, the trend remains bearish. This distinction is crucial for traders and investors who operate on different time frames, as short-term traders might see opportunities that long-term investors would avoid.
Further adding to the bullish narrative, momentum indicators for SHIB are looking positive. The Moving Average Convergence Divergence (MACD) line has moved above the MACD Signal Line, a bullish sign. Additionally, the Relative Strength Index (RSI) is above 55, indicating growing bullish momentum.
Doge2014 raises 500K in days celebrating Dogecoin. Make potentially big profits and get in on exclusive airdrop!
Show more +Support and Resistance Levels to Watch
As SHIB continues its upward trajectory, traders should know the key support and resistance zones. The nearest support zone is at $0.0000080, a previous resistance level. Following that, the next significant support lies at $0.0000055. On the upside, having broken the $0.0000100 resistance, SHIB is eyeing the $0.00001200 level next.
In conclusion, the recent technical patterns and indicators suggest a bullish phase for Shiba Inu. As always, traders and investors are advised to conduct their research and consider their risk tolerance. With the insights provided by altFINS, those interested in SHIB have a clearer picture of the current market dynamics.
We recommend eToro
Wide range of assets: cryptocurrencies alongside other investment products such as stocks and ETFs.
Copy trading: allows users to copy the trades of leading traders, for free.
User-friendly: eToro’s web-based platform and mobile app are user-friendly and easy to navigate.


