Shiba Inu (SHIB) Price Ignores Shibarium’s 78% Surge in Daily Transactions: Here’s What’s Really Going On


Shibarium recorded a strong recovery in daily transactions, although the SHIB price has refused to follow the same direction. That disconnect raises an important question about what currently controls Shiba Inu’s market value.
Network usage can support a cryptocurrency’s value over time, although transaction growth alone does not always create immediate demand for its native token. SHIB now faces broader market pressure, weak technical conditions, and resistance levels that could limit any near term recovery.
TheCryptoBasic reported that Shibarium processed 1,180 daily transactions during the latest recorded session. That represents a 78.51% increase from the 661 transactions completed on July 21.
July 21 produced the second lowest daily transaction count for Shibarium during July. The latest increase therefore marks a clear recovery from one of the network’s weakest sessions this month.
SHIB did not benefit from the higher activity. A broader cryptocurrency selloff pushed the Shiba Inu price from an intraday high of $0.000004243 to a low of $0.000004102.
Activity on Shibarium, #ShibaInu’s official Layer-2 blockchain, surged sharply over the past day, but $SHIB’s price has yet to respond.
— TheCryptoBasic (@thecryptobasic) July 24, 2026
According to the latest data from Shibariumscan, Shibarium processed 1,180 daily transactions yesterday. This marks a notable recovery from 661…
The token later recovered part of that decline and traded near $0.000004189. Despite that recovery, SHIB remained down 1.28% over 24 hours, 8.21% over 7 days, and 0.34% during July.
This difference between Shibarium activity and the SHIB price comes down to scale and market conditions. An increase of 519 transactions appears impressive as a percentage, although 1,180 daily transactions may remain too small to create meaningful demand for SHIB.
Broader market pressure has also outweighed the network improvement. Major cryptocurrencies fell during the latest selloff, which left Shiba Inu vulnerable despite the better Shibarium numbers.
What you'll learn 👉
Shiba Inu Price Remains Trapped Inside a Narrow Trading Range
Separate market data placed SHIB near $0.00000422, although small differences between data providers can occur. The broader picture remains largely unchanged across both price readings.
Shiba Inu has traded mostly between $0.00000415 and $0.00000441 during the past month. That narrow area shows that neither buyers nor sellers have gained firm control.
The latest performance data presents a mixed picture. SHIB gained about 1.13% over 24 hours and 1.67% across 7 days during the measured period. However, the Shiba Inu price remained down about 4.5% over 30 days and 68.38% over 1 year.
SHIB also trades approximately 95.23% below its record high. Its market capitalization stands near $2.49 billion, and daily trading volume remains close to $50.78 million.
Those figures show that Shiba Inu still maintains considerable market liquidity. However, current volume does not indicate the type of demand normally associated with a major SHIB price breakout.
SHIB Indicators Show Weak Momentum Despite Early Recovery Signs
A look at the SHIB chart reveals neutral to slightly bearish momentum. Several indicators have improved, although none provides strong confirmation that a lasting recovery has started.
The 7 day Relative Strength Index stands at 44.92. The 14 day reading stands at 41.64, and the 21 day figure comes in at 39.64.
RSI values between 40 and 50 normally point toward neutral or mildly bearish conditions. SHIB remains above the oversold level of 30, although it stays far below the overbought level of 70.
The higher 7 day RSI shows that recent performance has improved compared with the broader 21 day period. However, that improvement remains too limited to confirm a decisive trend reversal.
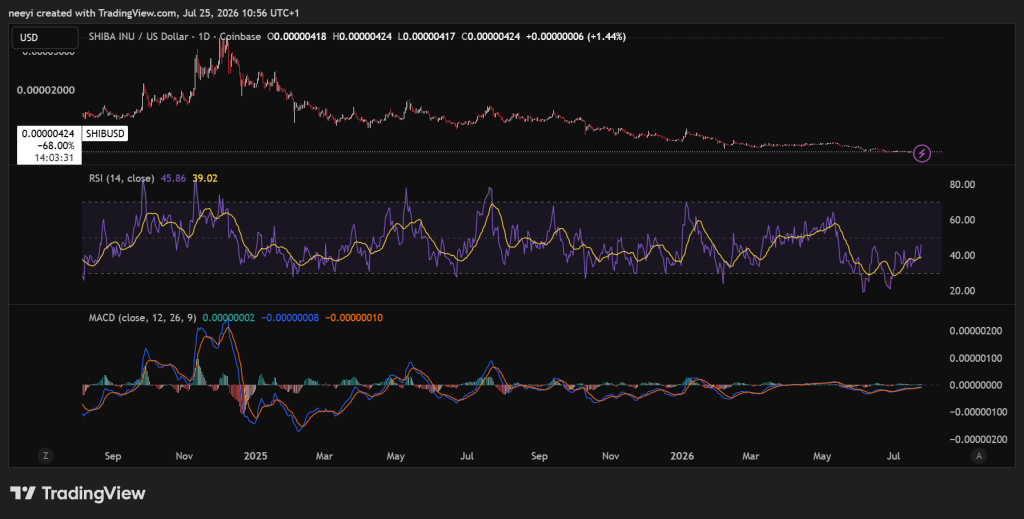
Moving averages provide a similar message. The 7 day simple moving average stands near $0.0000041943, and the 30 day average appears near $0.0000042548. The 200 day average remains much higher at $0.0000058789.
SHIB trades slightly above its 7 day average but below its 30 day average. More importantly, the large distance below the 200 day average confirms that the wider bearish trend remains intact.
The MACD line stands at negative $0.000000088442, compared with a signal line of negative $0.00000010812. Its histogram remains positive at $0.000000019679.
That combination shows that bearish pressure has eased somewhat. However, the extremely small values mean the recovery signal remains weak and could change quickly.
SHIB also trades just above the daily pivot near $0.000004159. That position gives buyers a slight near term advantage, although the narrow distance offers very little protection during another market decline.
Read Also: XRP Price Prediction: Analyst Who Predicted 500% Rally Says $15 Is Next
SHIB Price Could Remain Between $0.00000407 and $0.00000456
The current indicator mix creates 3 main SHIB price scenarios. Each outcome depends heavily on wider cryptocurrency conditions and whether Shibarium activity develops into stronger token demand.
Base Scenario Keeps SHIB Inside Its Current Range
Relatively stable market conditions could keep SHIB between support near $0.00000407 and $0.00000417 and resistance around $0.00000444 to $0.00000456.
The lower area includes the recent swing low and important Fibonacci levels. The upper area covers nearby Fibonacci resistance and the recent swing high.
This scenario would probably keep the RSI readings between 40 and 50. MACD could remain close to zero as buyers and sellers continue to contest the same narrow price area.
The recent increase in Shibarium transactions may help sentiment around the ecosystem. However, activity would need to remain elevated before it could provide stronger support for the Shiba Inu price.
Bullish Scenario Could Send SHIB Toward $0.00000487
Improved meme coin demand or stronger Shibarium developments could help SHIB challenge the recent high near $0.00000456. A confirmed move above that barrier would open possible targets between $0.00000470 and $0.00000487.
This outcome would require SHIB to remain above the daily pivot and its 7 day moving average. RSI readings would probably need to rise toward the 55 to 65 area, and the MACD histogram would need to become more positive.
A transaction increase across several sessions could make the network recovery more convincing. One strong daily reading alone does not confirm that Shibarium usage has entered a lasting expansion phase.
Bearish Scenario Could Follow a Break Below $0.00000407
Renewed weakness across the cryptocurrency market could push SHIB below its recent support near $0.00000407. A sustained break beneath that level would end the current range and expose Shiba Inu to new local lows.
RSI readings could fall toward 35 or lower under that outcome. MACD would likely return to a clearer negative position as selling pressure increases.
A fast recovery above the daily pivot would weaken this bearish scenario. SHIB would then need to reenter the area between $0.00000417 and $0.00000444 to restore its previous range.
Read Also: Cardano Price News: Hoskinson Says Bitcoin’s “Frozen” Governance Is Its Biggest Vulnerability
Shibarium’s 78.51% transaction increase looks encouraging when compared with the weak July 21 figure. However, the SHIB price remains controlled by broader market pressure and a difficult technical structure.
Network activity must remain stronger across a longer period before it can support a more convincing change in demand. SHIB must also reclaim nearby resistance and move closer to its 30-day average before the chart offers a clearer recovery case.
Shiba Inu now faces an important test between $0.00000407 and $0.00000456. The next move outside that range could reveal whether Shibarium’s transaction recovery has real staying power or remains a brief improvement during a difficult month.
FAQ
Subscribe to our YouTube channel for daily crypto updates, market insights, and expert analysis.