

Kaspa price move above the $0.09 mark has definitely caught the eye of traders and analysts. After briefly pushing as high as $0.096, it wiped out a chunk of short positions, showing real strength in momentum.
And it’s not just the price action turning heads, community sentiment on CoinMarketCap is sitting at a strong 97%, the highest it’s been in a while. With price still holding above its key trendline, the big question now is whether bulls can keep control or if the market will start sliding toward those lower liquidity zones.
Kaspa Daily Shared on X that most of the short liquidations happened during that run to $0.096. But there’s still a pocket of liquidity sitting between $0.07 and $0.075 that could come into play if price pulls back.
Kaspa has now cleared all visible liquidity to the upside, pushing as high as $0.096. With that move, most of the short liquidations have likely been flushed. However, major liquidity cluster sits much lower, between $0.07 and $0.075.
— Kaspa Daily (@DailyKaspa) July 17, 2025
If price begins to retrace, that zone could… pic.twitter.com/2hVu2mi1oc
Their other post highlights the surge in sentiment, suggesting growing confidence among Kaspa supporters. All of these lines up with the 4H chart, which shows a clean uptrend, but one that’s now entering a potentially key test.
What you'll learn 👉
KAS Trend Structure Remains Intact Above Ascending Support
The 4H chart for Kaspa price shows a steady uptrend, with higher highs and higher lows forming since early July. Price is currently trading near $0.0923 on MEXC, well above its 30-period EMA and an ascending orange trendline that has supported the trend.
This trendline has been a solid support point for a series of pullbacks. The significant demand area between $0.078 and $0.083 remains intact as well, functioning as a base of support for the latest leg up. As long as price remains above this confluence zone, the trend remains unblemished.
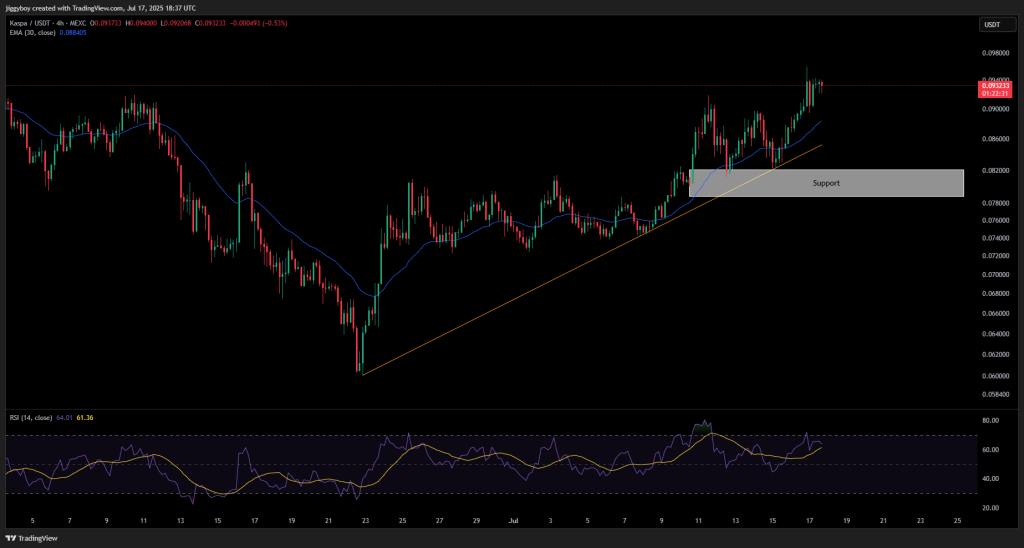
Kaspa Price Resistance Levels and Momentum Indicators
Price action briefly touched $0.09400 before consolidating. This local high now serves as the closest resistance, with psychological levels like $0.095 and $0.10 likely to attract trader interest. Although no heavy resistance blocks are identified on the chart, the current structure suggests potential for continued upside.
Technical indicators support this outlook. The 30-period EMA is trending upward and acting as dynamic support. RSI currently reads 61.36, staying in bullish territory without being overbought. The yellow signal line on the RSI is also rising, indicating renewed upward momentum after a brief cooldown.
Read Also: Analyst Predicts ‘Powerful Surge’ for Chainlink (LINK) Based on This Chart Setup
KAS Liquidity Zones and Sentiment Trends
Kaspa Daily noted that the recent push to $0.096 cleared visible liquidity overhead. With most short positions liquidated, the market now faces a decision point. If the bullish structure holds, the price may attempt another breakout.
However, any breakdown below the ascending trendline and $0.088 support could lead the price toward the $0.07–$0.075 liquidity zone.
Sentiment plays a role as well. The 97% bullish consensus on CoinMarketCap reflects that traders are overwhelmingly leaning towards a bullish outlook. While this corroborates the current trend, it also raises the question of whether the excitement has now been optimised.
Kaspa community sentiment on CoinMarketCap has surged to 97%, marking the highest level seen in quite some time.
— Kaspa Daily (@DailyKaspa) July 17, 2025
This reflects a strong wave of bullish sentiment among users, pointing to growing confidence and optimism around Kaspa outlook. pic.twitter.com/2ZuUxz7Uov
Kaspa price remains in a well-defined uptrend, with strong sentiment and strong support foundations below the current price. As long as $0.09 holds, traders may continue to favor the upside scenario. However, the $0.094 resistance and potential liquidity retrace zones will be key areas to monitor in the coming sessions.
Subscribe to our YouTube channel for daily crypto updates, market insights, and expert analysis.


