The SEI price has fallen back to a level that has defined every major turning point in its history. Sentiment across altcoins is still shaky, and many traders are cautious. But under the surface, something interesting is happening. Volatility is tightening, momentum is deeply stretched, and eyes are locked on this support zone.
Altcoin dominance is hovering near a potential five-year breakout, putting tokens like SEI in focus for a possible sharp weekly move. On top of that, the SEI price recently printed its lowest 3D RSI since 2022.
The last time momentum reached this kind of extreme, it was followed by a strong rebound. Now, with price stabilizing at historic support, Whale Factor believes this may be the “final gift” before a recovery toward $0.30.
What you'll learn 👉
SEI Chart Structure: Three Major Tops, Now Cap 3
Looking at the weekly chart shared by Whale Factor, the pattern stands out clearly. The SEI price formed three major peaks, labeled Top 1, Top 2, and Top 3. Each top was followed by a significant correction. In between those peaks, rounded bottom formations appeared, Cap 1, Cap 2, and now Cap 3.
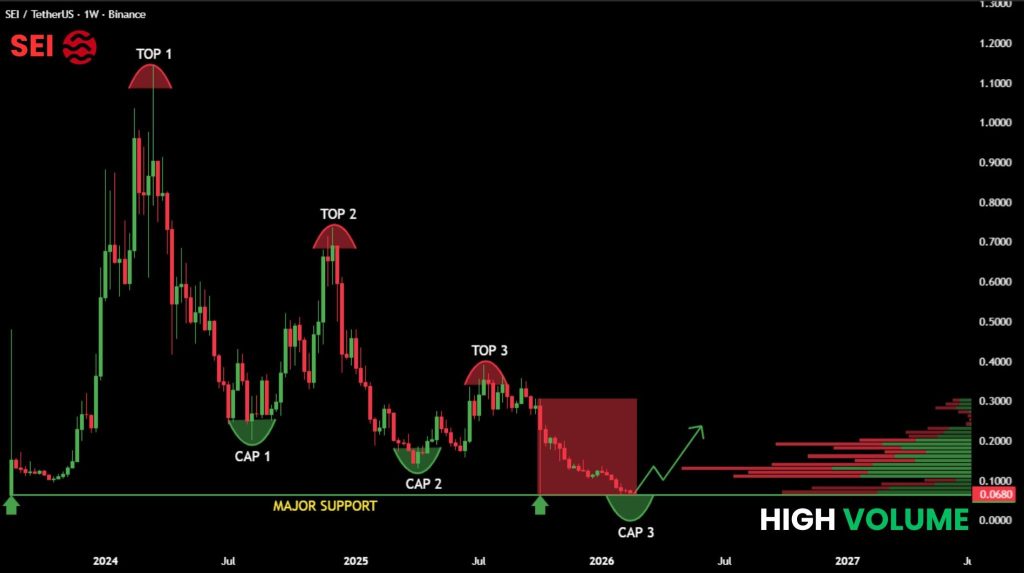
At the moment, the SEI price is sitting directly on a horizontal green line marked “Major Support.” This level has acted as the floor during previous downturns. Every time price returned here in the past, liquidity below prior lows was swept before stabilization.
That sweep looks complete again. The recent red selloff box on the right side of the chart shows the latest flush into this zone. Now Cap 3 is forming right on the same historic level that sparked earlier reversals.
The volume profile on the right adds another layer. There is a dense high-volume shelf between roughly $0.10 and $0.20. Above that, liquidity thins out toward $0.30. If the SEI price starts reclaiming the range, that high-volume area could pull price upward during any expansion phase.
Deeply Oversold and Compressing
The momentum picture strengthens the argument. The SEI price recently printed its lowest 3D RSI reading since 2022. These kinds of oversold conditions do not appear often, and historically they have preceded strong bounces.
At the same time, price action is compressing right on major support. When markets tighten at key historical levels, the next move is often decisive. Whale Factor’s thesis is straightforward. The tops are behind us, liquidity has already been taken, and Cap 3 could be the final consolidation before a broader recovery phase.
Read Also: USDCx Launches on Cardano: Fee-Free Bridging for the First 10 Days
Can SEI Reclaim $0.30?
The path mapped on the chart points toward the $0.30 region. That level lines up with previous distribution zones and sits near the upper edge of the visible volume structure.
For this scenario to play out, the SEI price needs to hold above major support and begin printing higher highs on the weekly timeframe. If price closes decisively below support and accepts under it, the bullish thesis weakens significantly.
Right now, the SEI price is at a crossroads. It is either building a base at the most important support in its history or preparing for a deeper downside. With liquidity already swept, momentum stretched, and volume stacked above, this zone carries real weight.
The next few weekly candles will likely determine whether this becomes a launchpad toward $0.30, or a trap that breaks historic support.
Subscribe to our YouTube channel for daily crypto updates, market insights, and expert analysis.