SEI price has shown moments of strength, then periods of weakness which could create mixed signals for investors.
After falling from higher levels earlier in the year, Sei token is now flashing signs that a short-term move might be around the corner. The question is whether this potential bounce could turn into something bigger.
Crypto analyst Ali shared an interesting observation on X. He pointed out that the SEI price just flashed a buy signal on the TD Sequential indicator at the monthly open. The last time this happened, the Sei token peaked soon after.
$SEI is screaming buy!
— Ali (@ali_charts) September 23, 2025
The last time TD Sequential called it, $SEI topped. Now it just flipped buy at the monthly open. I’m loading here! pic.twitter.com/LYi8fFJHXV
His idea suggests that the signal could be showing another opportunity for a move higher, although it does not confirm how strong or lasting that move might be.
What you'll learn 👉
What the SEI Price Chart is Saying
The SEI chart shows the token rebounded from the bottom of a triangle pattern. This rebound signals short-term strength and could fuel a move of about 10% toward the top of the pattern. Still, the wider trend cannot be ignored.
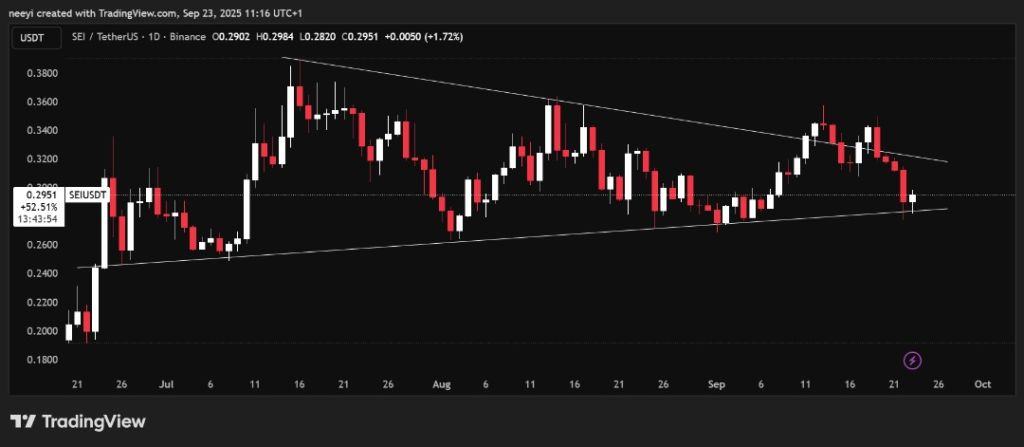
Since July, SEI has formed lower highs, which is a bearish sign. For a stronger bullish case, the Sei token would need to break out of the triangle and overcome this downward structure. In simple terms, the setup looks positive in the short run, but the bigger trend remains cautious until a clear breakout happens.
SEI Technical Indicators Point to Weakness
Daily technical indicators from investing.com show that momentum is still leaning bearish despite the chart setup. The table below summarizes what the values are saying:
| Name | Value | Action |
| RSI (14) | 43.507 | Momentum is weak and sellers remain active |
| STOCH (9,6) | 44.302 | Market is not showing strong bullish pressure |
| MACD (12,26) | -0.002 | Bearish momentum is still present |
| Highs/Lows (14) | -0.0192 | Price is leaning toward the lower range |
| Ultimate Oscillator | 48.297 | Momentum is lacking strength |
| ROC | -4.88 | Downward movement still dominates |
The summary of these signals is a Strong Sell, which means the SEI token still has significant pressure weighing it down.
Is the Next Big Move Coming?
SEI price is showing an interesting setup. Ali’s view notes a buy signal that could support a near-term bounce. The chart confirms this possibility with the triangle pattern suggesting a potential 10% move higher.
Read Also: Time to Accumulate Kaspa (KAS) Again? Analyst Reveals What’s Coming
At the same time, technical indicators still point toward weakness, keeping the bigger picture bearish unless a breakout above the triangle and lower highs happens. Sei token looks like it could make a short-term move, but whether it turns into the next big breakout depends on the coming sessions.
Subscribe to our YouTube channel for daily crypto updates, market insights, and expert analysis.