Wednesday belongs to SEI, at least so far. The price exploded over 27%, which means SEI is now trading around $0.46.
Sei (SEI) is a Layer 1 blockchain and a competitor of SUI, Solana, and many other networks. In fact, many call SEI a direct competitor and clone of SUI.
However, SEI has a significantly lower market cap of around $1.6 billion, while SUI is now well over $4.5 billion. Solana is, of course, a huge-market cap project now with around $70 billion.
What you'll learn 👉
Comparing SEI, SUI, and SOL: A Technical Analysis
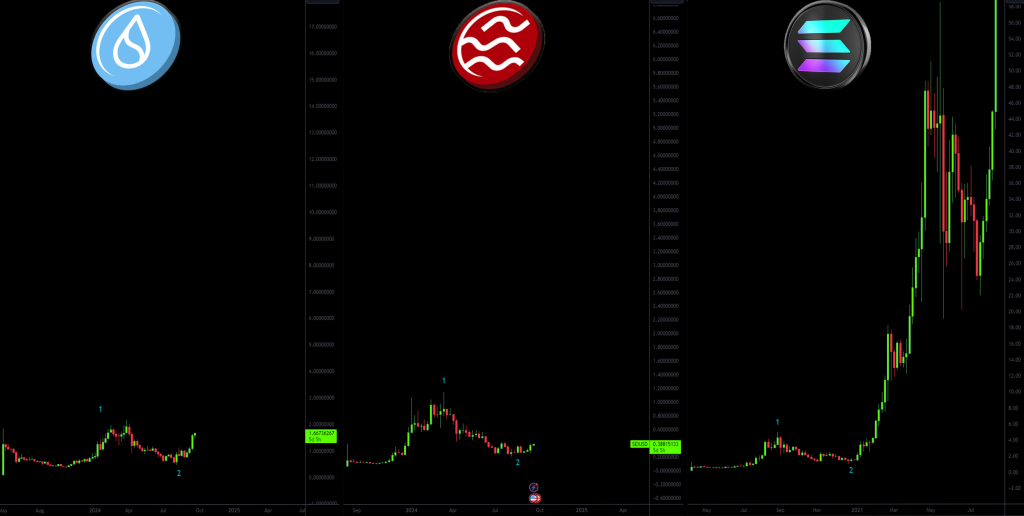
Analyst ‘Donovan Jolley’ compared SEI, SUI, and SOL charts, revealing interesting similarities in their price patterns. SOL’s chart shows an exponential rise after a period of consolidation at low prices, resulting in a massive breakout and rapid price increase. This suggests that SOL’s potential was recognized early, leading to a parabolic rally.
SUI’s price action mirrors the early pattern of SOL, with a wave 1-2 structure hinting at a potential bottoming process. Currently trading around $1.67, SUI shows signs of recovery and may be preparing for a larger impulsive wave if conditions remain favorable.

SEI also presents a wave 1-2 structure similar to SUI and SOL. After a significant correction, SEI is showing early signs of potential recovery, trading around $0.46. If SEI can maintain support around the $0.368 level and continue to break resistance levels, it could potentially mirror SOL’s past bull cycle.
The wave 1-2 pattern is a critical formation indicating a potential reversal after consolidation and bottoming out. Both SEI and SUI display these characteristics, suggesting the possibility of upward movement. SEI’s current price resembles SOL’s pre-breakout structure during the 2021 cycle, with a base formation and gradual upward movement.
Doge2014 raises 500K in days celebrating Dogecoin. Make potentially big profits and get in on exclusive airdrop!
Show more +Viral Tweet Highlights SEI’s Bullish Indicators
A recent tweet by “Cryptoinsightuk” about SEI went viral, highlighting several bullish indicators for the cryptocurrency. The price has clearly broken out of a short-term consolidation range, with recent swing highs around $0.4164 and $0.3719. This breakout appears impulsive, often considered a strong bullish signal.
The sharp rise in price from its lows to around $0.4594 suggests strong buyer control. This upward momentum could potentially continue if the resistance zones hold as new support.
Open Interest (OI) in the SEI futures market is rising, indicating an increasing number of positions being opened. This is generally seen as a bullish sign when coupled with price increases, as it shows strong participation in the rally.
What’s interesting here is that the funding rate is negative (-0.017) which means that there are more shorts than longs in the market. This sets up the possibility of a short squeeze, where traders betting on price decreases and might be forced to cover their positions by buying back, potentially accelerating the SEI price upwards even further.
The significant increase in spot volume (109.493M) shows strong demand for SEI in the spot market. High spot volume backing a price move is often a strong confirmation of real demand, reinforcing the idea that the rally could be sustained.
Read also: Watch This XRP Price Level Closely as Indicators Suggest Potential Surge for Ripple’s Token
Subscribe to our YouTube channel for daily crypto updates, market insights, and expert analysis.
We recommend eToro
Wide range of assets: cryptocurrencies alongside other investment products such as stocks and ETFs.
Copy trading: allows users to copy the trades of leading traders, for free.
User-friendly: eToro’s web-based platform and mobile app are user-friendly and easy to navigate.


