
RENDER is finally showing signs of a shift on the 4-hour chart. After weeks of grinding lower inside a falling wedge, price has pushed through the upper trendline and now, it moves away from it. That matters, because this kind of structure usually breaks when selling pressure runs out instead of when sellers are in control.
What stands out is how the breakout played out. Volatility had been tightening, price action was compressing, and each sell-off was doing less damage than the last. Once buyers stepped in, the RENDER price broke higher and did not slip back into the wedge immediately..
What you'll learn 👉
Why This RENDER Falling Wedge Break Is Getting Attention
On the 4-hour chart shared by Clifton a falling wedge is showing up and this normally happens near the end of corrective phases, and that seems to be the case here.
Even though the RENDER price was still printing lower highs, the downside momentum was fading. Sellers were pushing, but they were not getting much in return.
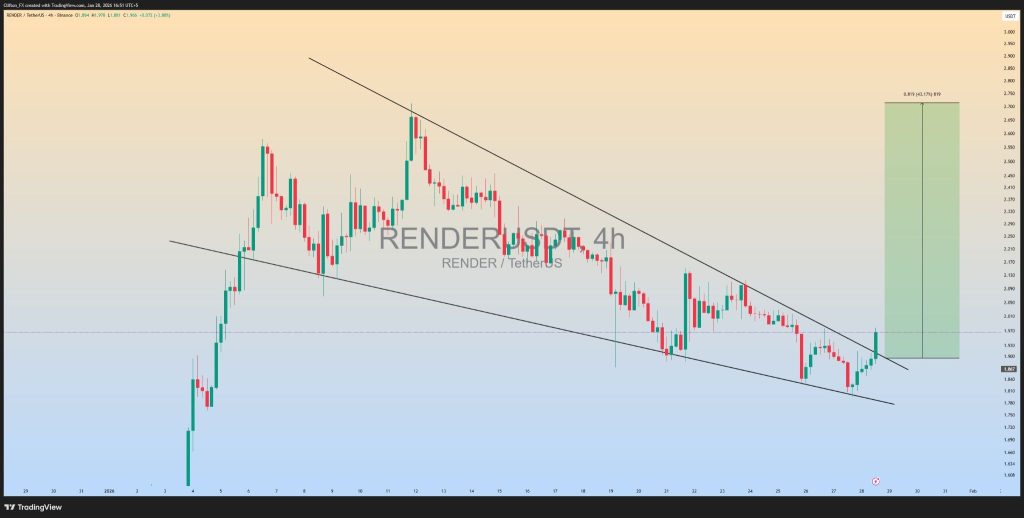
Once price cleared the top of the wedge, it opened space for a broader move. The upside projection on the chart highlights how much room the RENDER price could have if momentum continues to build.
It does not mean price shoots straight up, but it does show that this breakout is coming from a compressed base and not an overheated rally. As long as the RENDER price stays above the former wedge resistance, the breakout structure remains valid.
The RENDER Daily Chart Adds Confirmation
The daily chart helps put the move into context. The RENDER price dipped into a key Fibonacci support zone between $1.75 and $1.85, briefly tagging around $1.81 before buyers stepped in.
The price didn’t continue going lower, it quickly bounced back above $1.90, which is exactly what a clean support test usually looks like.
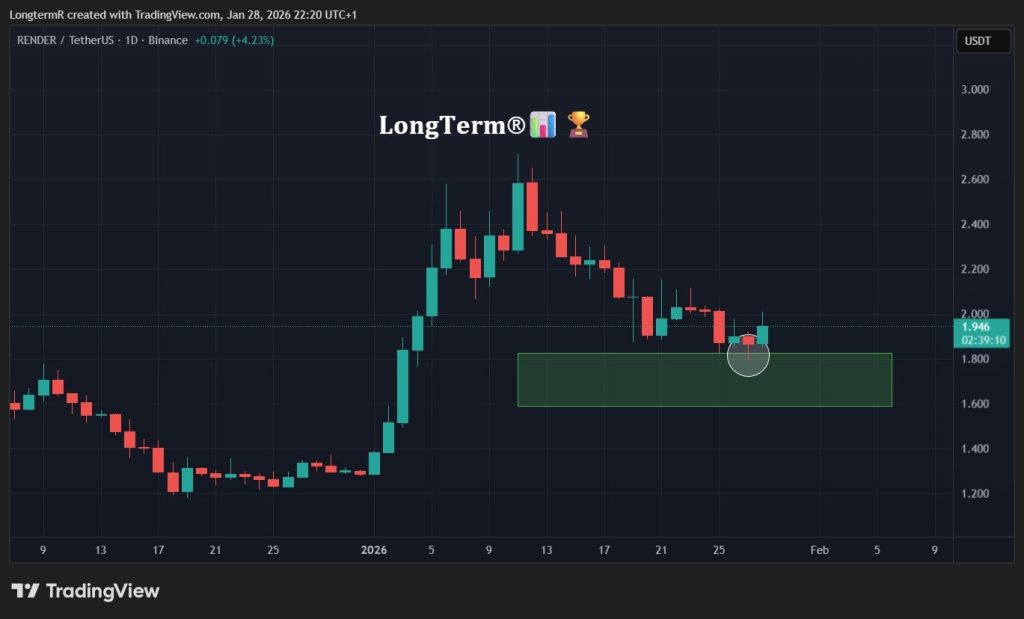
That kind of response suggests there was real demand waiting at those levels. It also supports the idea that this pullback was more of a reset than the beginning of a deeper decline, especially with buyers stepping in so decisively.
With the daily bounce lining up nicely with the 4-hour breakout, the RENDER price continues to hold a constructive structure as long as it stays above the $1.80 zone.
Read Also: Kaspa (KAS) Price Prediction for February: Recovery Remains Unlikely
What Needs to Happen Next
Right now, the RENDER price is sitting at a clear decision point. The 4-hour chart is building steam, and on the daily chart, the support continues to hold at the critical price range of $1.80–$1.85.
In order to sustain the bullish view, the price needs to hold above the recent higher low at $1.81 and not fall back below the former breakout range at $1.85. As long as that happens, the structure remains constructive.
However, if the buyers continue to be on the upper end, RENDER could continue to move towards even stronger resistance levels of $2.10 and $2.30, which were out of reach during the fall.
But if the support levels continue to fall, the chances are that the stock will continue to move sideways between $1.75 and $1.95. The momentum is changing, and the key will be to see if the stock can move above $2.00 and hold on to the level.
Subscribe to our YouTube channel for daily crypto updates, market insights, and expert analysis.