
Render has entered a phase that many long term traders recognize well. RENDER price once climbed from deep accumulation levels to an explosive rally that pushed the token above $13. That expansion delivered one of the strongest moves in the market during the previous cycle. Current market structure now shows a pattern that resembles the early stage of that earlier move.
The latest chart shared by analyst Crypto Patel explains why this setup matters. Crypto Patel argues that RENDER may be forming the same macro structure that appeared before the previous multi-year rally. The chart shows the token deep inside a long correction phase that has already erased most of the prior gains.
Crypto Patel explains that RENDER dropped about 91% from the previous all time high near $13.83. The chart shows price falling into a wide demand region that sits roughly between $1.35 and $1.00. This region appears on the chart as a bullish order block. Long term investors often view these areas as accumulation zones.
The RENDER chart also shows a descending channel that has guided the correction for several months. Price repeatedly failed near the upper boundary of that channel and continued to move downward. The latest candles now sit near the bottom portion of the structure.
Crypto Patel believes this part of the chart represents a macro accumulation phase. The price structure shows compression inside the demand zone. Long corrections inside strong support areas sometimes appear before the next expansion cycle begins.
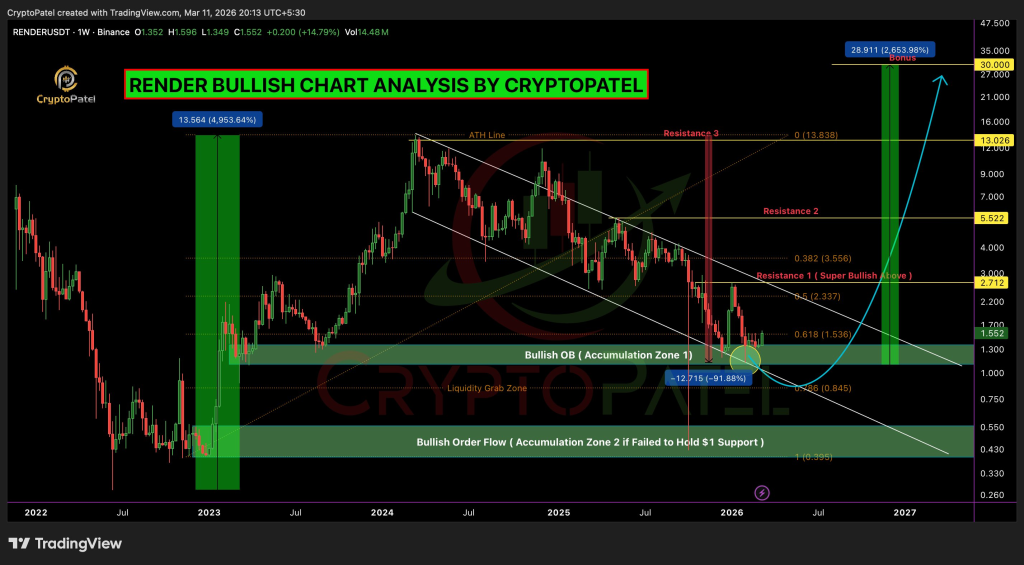
The chart also marks a possible liquidity grab region slightly below $1. Crypto Patel explains that price often sweeps those levels to collect liquidity before reversing upward.
Key Fibonacci And Support Levels Define The Current RENDER Price Structure
Several technical levels appear on the chart that help explain the current setup. Crypto Patel highlights the 0.618 Fibonacci retracement near $1.536 and the deeper 0.786 retracement near $0.845. These levels represent areas where long term buyers often enter positions.
Crypto Patel states that the bullish structure remains valid as long as the $0.845 level holds on higher timeframe closes. The chart marks that region as the final invalidation level for the bullish scenario.
The chart also shows a second demand region lower on the structure. This zone sits between roughly $0.60 and $0.40. Crypto Patel explains that this secondary accumulation area could come into play if the current support fails to hold.
Market structure therefore places the most important decision zone between $1.35 and $0.845. Price stability above that region keeps the long term bullish thesis intact.
Read Also: CHINA’S $214B ATTACK: What Happens To $89 Silver Tonight…
RENDER Price Must Reclaim $2.71 To Confirm Trend Reversal
The chart identifies $2.71 as the first major resistance that RENDER must overcome. Crypto Patel labels this level as the point where the descending channel structure breaks.
A sustained move above $2.71 would reclaim the market trend. Crypto Patel explains that such a breakout would signal that the long correction phase may be ending.
Several additional resistance zones appear above that level. The chart marks $5.52 as the next resistance. The previous all time high region near $13 forms another major barrier that would need to break before the next expansion phase develops.
Crypto Patel also outlines a long term scenario where RENDER could eventually move toward the $28 region if the broader crypto cycle strengthens again. The chart shows that projection through a steep upward curve once the channel resistance breaks.
Read Also: Could Silver Price Reach $300 in 2026? Analyst Makes Shocking Prediction
Historical context explains why this setup draws attention. The earlier RENDER cycle produced an enormous expansion move. The token climbed from about $0.274 to $13.83 during that rally. That move represented a gain of roughly 5,000%.
Crypto Patel believes deep retracements often appear before the next major cycle expansion. The current correction phase now resembles the accumulation periods that appeared before earlier market rallies.
Render now trades inside a technical structure that many analysts consider a turning point zone. Price compression inside a demand area often precedes large directional moves.
Subscribe to our YouTube channel for daily crypto updates, market insights, and expert analysis.