Pudgy Penguins (PENGU) Price Rockets Out of Accumulation Zone – Analyst Says New All-Time High May Be Next

Pudgy Penguins price is starting to turn heads again after finally breaking out of its long-term sideways range. The token had been stuck moving back and forth for months, but that changed when it broke through a key resistance level and retested it like clockwork.
Now, according to chart watchers and a tweet from Batman, it looks like PENGU might be setting up for a run toward a new all-time high.
The breakout didn’t come out of nowhere. PENGU price had been holding strong inside a demand zone, quietly building a base. Then a strong daily candle pushed it above that ceiling, and instead of fizzling out, price came back down to retest the breakout level and bounced. Since then, it’s been forming higher lows, and volume has picked up, classic signs that bulls are in control and momentum is building.
What you'll learn 👉
PENGU Price Breakout Confirms Shift From Accumulation to Markup
Based on the PENGU daily chart, price action has transitioned from a long period of compression into a vertical markup phase. The accumulation zone, identified between $0.045 and $0.065, held through much of the first half of the year. The breakout occurred with a wide-bodied candle, signaling strong buying interest.
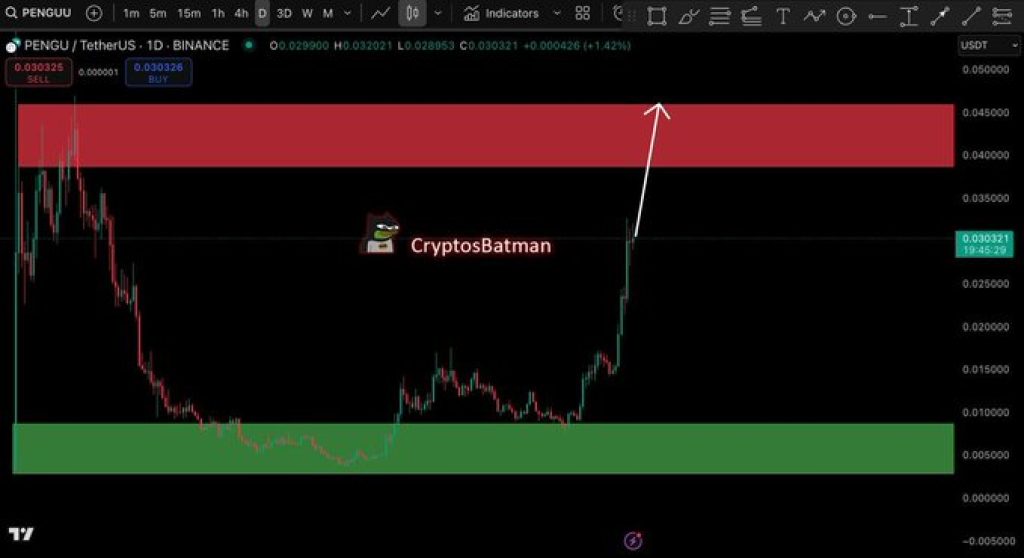
After briefly pulling back to retest the breakout level, price continued upward, forming an ascending structure with higher lows. The impulse rally, which carried PENGU price from approximately $0.12 to above $0.30, came alongside expanding volume, indicating participation from larger market participants.
Current momentum places the next technical target at the $0.40–$0.46 resistance zone. This area marks a previous distribution cluster formed in February and March, and is expected to act as the next supply wall.
Volume Expansion Supports Pudgy Penguins Price Momentum
Volume analysis reinforces the strength of the current trend. As price moved upward, volume bars grew consistently, suggesting that buyers are entering the market with conviction.
According to the chart’s visual cues, there is no indication of weakening demand at this stage. Although the RSI indicator is not visible on the shared chart, it is likely elevated given the speed of the move, though overbought conditions can persist during strong trends.
The structure of momentum remains in favor of bullish continuation as long as the price is above $0.15. There can be a pause or consolidation between $0.25 and $0.32, which may provide a chance for technical indicators to stabilize before any further push towards the red supply area.
Read Also: Why Is the Crypto Market Down Today as Bitcoin Price Falls Below $118K?
PENGU Price Potential Scenarios and Technical Outlook
If current momentum continues, bulls may attempt to test the $0.40–$0.46 range in the near term. Should price break through this zone with confirmation, PENGU could enter price discovery mode, raising the possibility of a new all-time high.
Conversely, failure to maintain current levels could open the door for a deeper pullback. The most important support to monitor is still the $0.15 mark. A close below that level for a sustainable period would nullify the bullish breakout and revive attention back to the accumulation zone.
For the time being, the technical outlook for Pudgy Penguins price remains in favor of continuation to the upside, supported by rising volume, higher lows, and a confirmed breakout pattern.
Subscribe to our YouTube channel for daily crypto updates, market insights, and expert analysis.