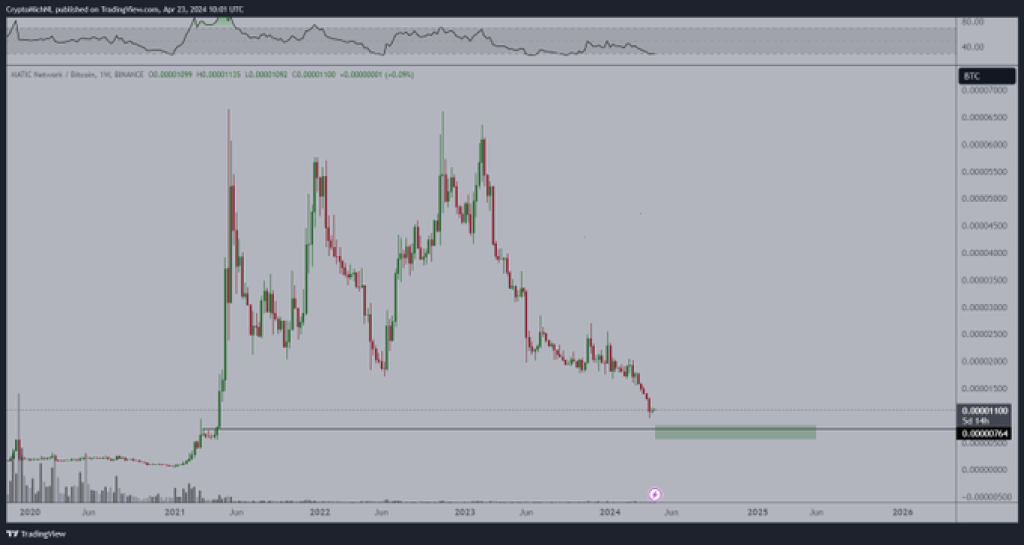
Polygon (MATIC), the popular Ethereum scaling solution, has been facing significant challenges in recent weeks, with its price chart being described as “absolutely disgraceful” by renowned crypto analyst Michaël van de Poppe.
The token’s underperformance has raised concerns among investors and traders alike, prompting a closer examination of its technical indicators and potential trade setups.
What you'll learn 👉
Michaël van de Poppe’s Perspective
In a recent tweet, Michaël van de Poppe expressed his disappointment with Polygon’s price action, stating that the token is “underperforming massively.”

He suggested that he might consider investing in MATIC if it drops another 30%, as this could potentially indicate a rotation point. However, van de Poppe also emphasized that there may be better opportunities available in the market at present.
Doge2014 raises 500K in days celebrating Dogecoin. Make potentially big profits and get in on exclusive airdrop!
Show more +Technical Analysis by altFINS
A detailed technical analysis by altFINS from April 22 provides valuable insights into Polygon’s current price action and potential trade setups.
Trade Setup
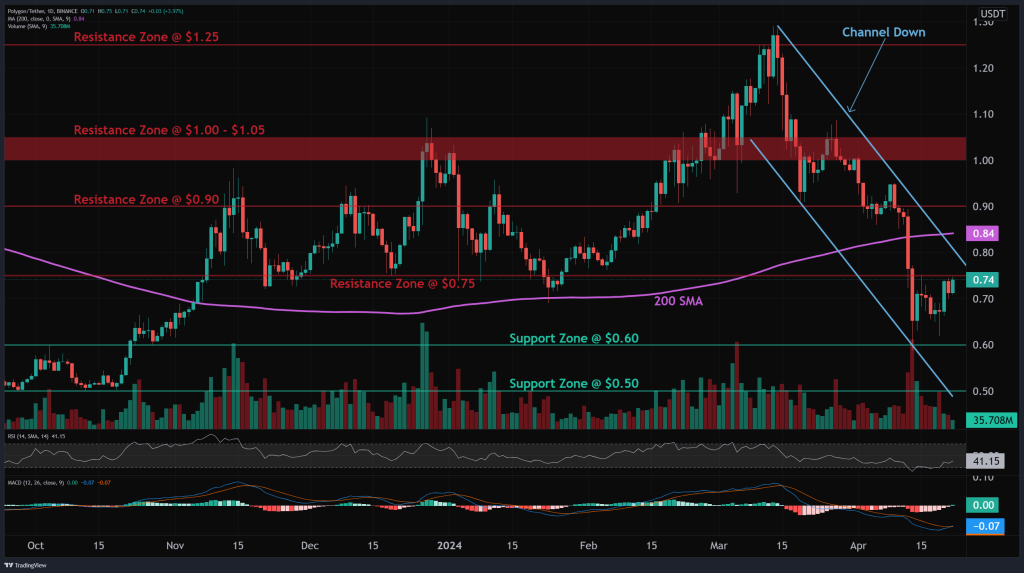
Polygon’s price trends are currently mixed, with the token trading within a Channel Down pattern. After bouncing off the channel support at $0.60, MATIC is now approaching a significant resistance area, which includes the channel resistance trendline and a horizontal resistance level at $0.75.

Source: altFINS – Start using it today
For swing traders, the current setup presents an opportunity to trade within the channel, entering near the support and exiting near the resistance. Trend traders, on the other hand, are advised to wait for a breakout above the $0.75 level before initiating a position.
Pattern Analysis
Polygon is currently trading within a Channel Down pattern, which is considered a bearish formation. Traders who believe that the price will remain within the channel can initiate trades when the price fluctuates between the channel trendlines. However, if a breakout occurs, either above or below the channel, the price can move rapidly in the direction of the breakout.
Trend and Momentum
The trend analysis for Polygon reveals a downtrend on both short-term and medium-term timeframes, while the long-term trend remains bullish. The momentum indicators are currently mixed, with the MACD (Moving Average Convergence Divergence) line above the MACD Signal Line, indicating a bullish momentum, while the RSI (Relative Strength Index) is below 45, suggesting a bearish momentum.
Support and Resistance Levels
The nearest support zone for Polygon is located at $0.60, followed by $0.50. On the upside, the token faces significant resistance levels at $0.75 (previous support), $0.90, and the $1.00-$1.05 range.
Polygon’s recent price action has been disappointing, with the token underperforming significantly compared to other cryptocurrencies. While Michaël van de Poppe suggests that a further 30% drop could potentially indicate a rotation point, he also highlights the availability of better investment opportunities in the market.
Subscribe to our YouTube channel for daily crypto updates, market insights, and expert analysis.
We recommend eToro
Wide range of assets: cryptocurrencies alongside other investment products such as stocks and ETFs.
Copy trading: allows users to copy the trades of leading traders, for free.
User-friendly: eToro’s web-based platform and mobile app are user-friendly and easy to navigate.


