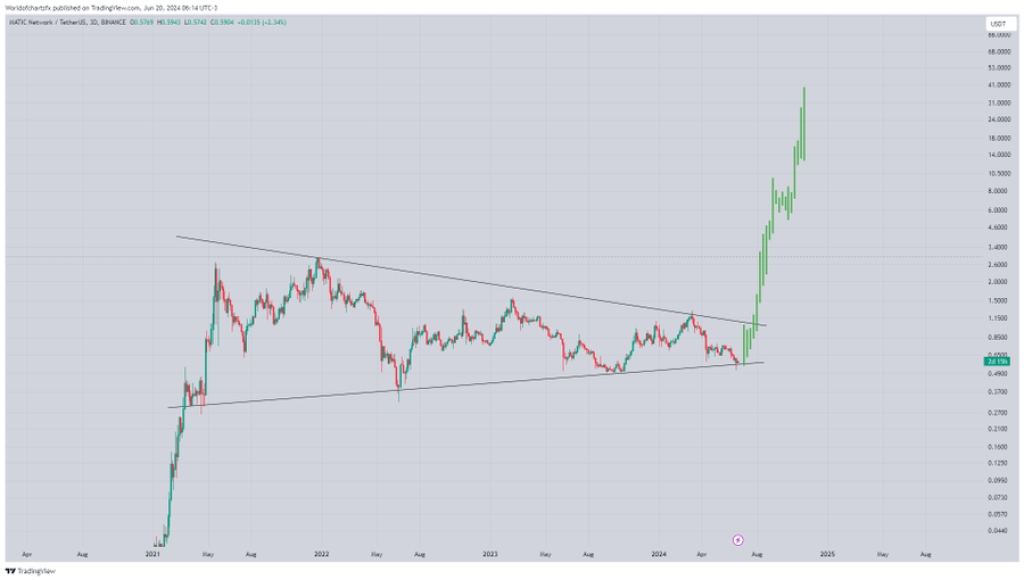
In his latest tweet, cryptocurrency analyst World Of Charts has suggested that the current price levels of Polygon (MATIC) may be the last opportunity for investors to accumulate the token before a massive alt season takes hold.
The analyst is adding more MATIC to their portfolio, expecting a solid bullish wave that could propel the token’s price towards the $4-$5 range in the mid-term.
Bullish Falling Wedge Pattern Indicates Potential Breakout

Supporting the bullish sentiment, analyst The Cryptomist has identified a bullish falling wedge pattern on the MATIC 1-day chart. This technical formation suggests that MATIC is ready to explode, with the first target set at $0.73 and the second target around $0.89-$0.90. The Cryptomist expects the breakout to occur soon, signaling a potential surge in the token’s price.
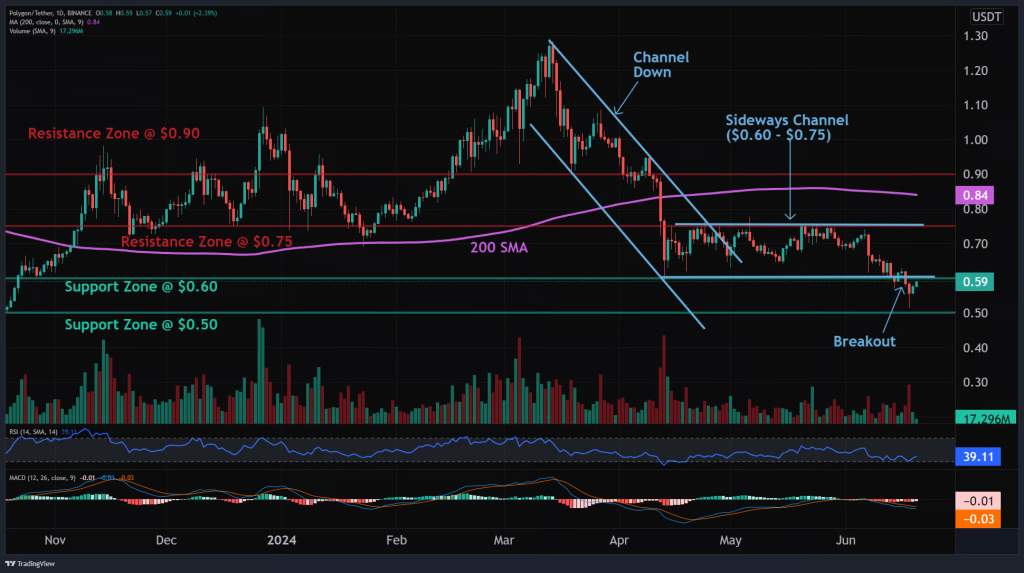
However, a technical analysis by altFINS presents a slightly different perspective. The analysis indicates that MATIC has experienced a bearish breakout from a sideways channel between $0.65 and $0.75, confirming the ongoing downtrend. As a result, the price could revisit the $0.50 level next.
Doge2014 raises 500K in days celebrating Dogecoin. Make potentially big profits and get in on exclusive airdrop!
Show more +altFINS notes that the overall price trend remains in a downtrend until MATIC breaks back above the 200-day moving average. The platform suggests setting a price alert to monitor potential trend reversals.
According to altFINS, MATIC is currently trading in a sideways channel, which is considered a neutral pattern, indicating market indecision. Trend traders are advised to wait for a breakout in either direction, although typically, the breakout occurs in the direction of the existing trend. Swing traders, on the other hand, can trade the range by buying near support and selling near resistance.

Source: altFINS – Start using it today
The short-term, medium-term, and long-term trends for MATIC are all classified as strongly down, as per the altFINS analysis. However, the momentum is currently bearish but inflecting.
The MACD line is still below the MACD signal line, but the rising MACD histogram bars suggest that momentum could be nearing an upswing. The RSI-14 levels indicate that the price is neither overbought nor oversold at the moment.
altFINS identifies the nearest support zone for MATIC at $0.50, while the nearest resistance zones are located at $0.75 and $0.90.
Read more: Crypto Analysts Update Their Bitcoin Price Predictions, But Here’s a Catch
Subscribe to our YouTube channel for daily crypto updates, market insights, and expert analysis.
We recommend eToro
Wide range of assets: cryptocurrencies alongside other investment products such as stocks and ETFs.
Copy trading: allows users to copy the trades of leading traders, for free.
User-friendly: eToro’s web-based platform and mobile app are user-friendly and easy to navigate.


