
Polygon (POL) is showing some life again. The token jumped more than 7% today, trading around $0.2195, after spending most of the past week drifting under the $0.20 mark. It’s a decent bounce for a market that has been under pressure for weeks, but the bigger trend hasn’t turned just yet.
The recent price action tells the story of a market trying to find its footing. Since early June, POL has been sliding lower with a few failed attempts to rally. The token briefly climbed above $0.30 in early July, but that spike didn’t hold. Sellers came back in quickly, and by the end of the month, the price had fallen to just below $0.19, which became a short-term support level.
Today’s move pushed POL closer to the $0.21–$0.22 zone, and all eyes are now on the 200-day moving average, sitting near $0.2438. That long-term trend line has acted like a ceiling for months. Until the price can close above it, the market is still technically in a downtrend.
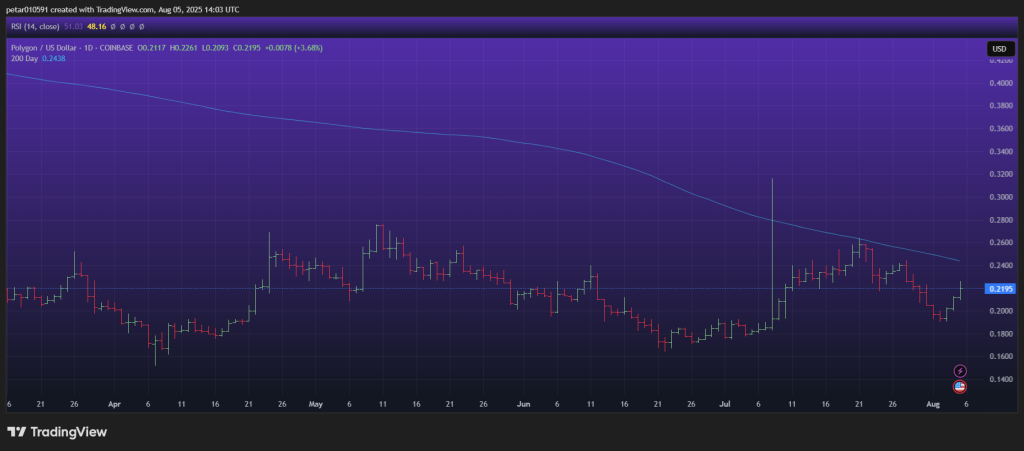
Momentum on the daily chart looks better than it did last week. RSI is sitting around 51, which is neutral territory. It means POL has room to keep moving without being overbought. The candles themselves also tell a small story of recovery – after a series of red days through late July, we’re finally seeing a cluster of green candles building some short-term confidence.
The weekly indicators, however, are still cautious. The Ultimate Oscillator at 42 shows that momentum leans bearish on the larger timeframe. ROC is negative at –3.9, confirming that the bigger trend has been down. Bull/Bear Power is just slightly negative, which means sellers are not fully in control, but they haven’t stepped aside either.
Looking ahead, $0.23 is the first level to watch. If POL can break and hold above it, a run toward the 200-day MA around $0.24–$0.25 becomes possible. That would be the first real sign that buyers are taking over. On the flip side, failing to stay above $0.21 could send the price back to $0.20, and a clean break below that level might see another test of $0.18.
For now, short-term traders have something to work with, but the bigger trend is still against the bulls. A decisive move above the 200-day moving average will be the signal that the tide is finally turning.
Read also: XRP and the Citadel Plan: Could Ripple Be the Token of a Post-Collapse World?
Subscribe to our YouTube channel for daily crypto updates, market insights, and expert analysis.