
Crypto Patel shared on X about Polkadot that makes you stop and zoom out. He’s looking at the two-week chart, and the pattern he’s seeing is eerily similar to what happened before DOT’s massive run to $55. That rally delivered a 4,529% gain.
The DOT price is currently trading around $1.46, which sounds tiny compared to where it’s been. But that’s kind of the point. This is the phase nobody wants to be in. The boring part. The part where you sit in a range for months, maybe years, while everyone else chases the shiny new thing.
The DOT Structure That Keeps Repeating
If you look at the chart Patel shared, the pattern is hard to ignore. DOT peaked at $55 back in 2021, then spent the next few years grinding lower. Lower highs, lower lows, classic bear market structure.
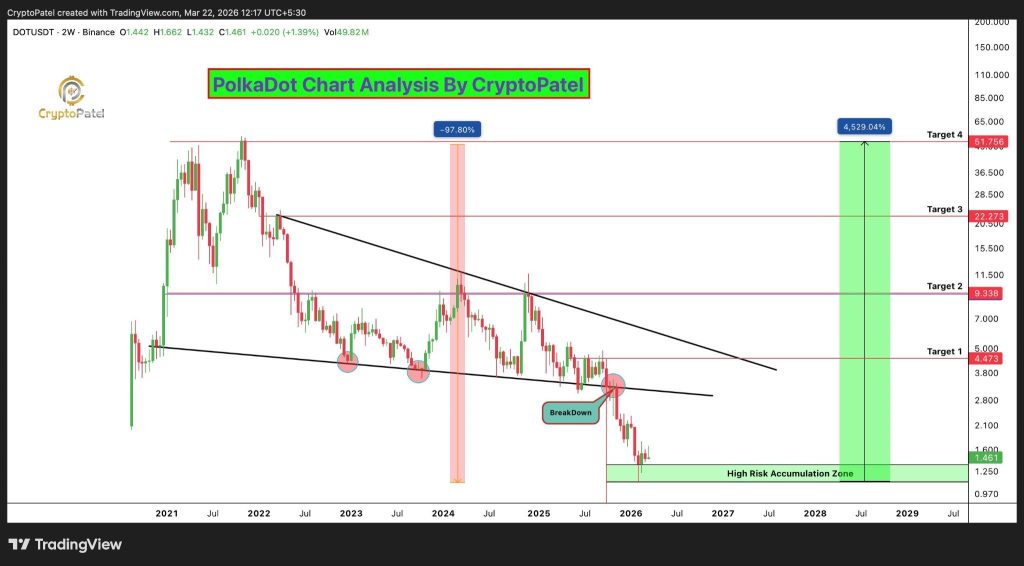
The DOT price dropped 97.8% from the all-time high. That’s brutal. But that kind of drawdown is also what Patel calls the “corrective accumulation phase.”
The current accumulation zone is marked between $1.30 and $1.10. That’s where Patel sees the high-risk opportunity. And he’s clear about the risk part. If the DOT price closes a week below $1.20, the setup is invalid. That’s the line in the sand.
Read Also: DeepSeek AI Predicts the Price of Hedera, XRP and Polkadot by The End of 2026
What Needs to Happen for a Breakout
The DOT price hasn’t flipped bullish yet. Patel is very clear about that. The structure is still bearish until Polkadot reclaims and holds above $4.50. That’s the level that would break the descending channel that’s been in place since the 2021 top.
Patel’s targets if this plays out are wild. First target at $4.47, which is basically the breakout level. Then $9.33, $22.27, and finally $51.75. That last one would take the DOT price back to its all-time high.
He calls this a “high risk accumulation zone” for a reason. The DOT price could break below $1.20, and if it does, the setup is done. No ifs, no buts. Weekly close below that level, and the pattern is invalid.
For now, DOT is sitting in the zone, but it hasn’t shown strength yet. No bullish structure break, no reclaim of key levels. Just a compressed pattern near multi-year lows.
Subscribe to our YouTube channel for daily crypto updates, market insights, and expert analysis.