Polkadot has been rallying, up more than 55% in the last 2 weeks. This price spike might be just the beginning, as popular analyst World of Charts is seeing a possibility of another 100% price spike.
From his observations, Polkadot has recently experienced a rally, achieving over 40% profit from its lows. This positive trend positions the cryptocurrency near a crucial descending trendline, which has historically served as a barrier to upward movement.
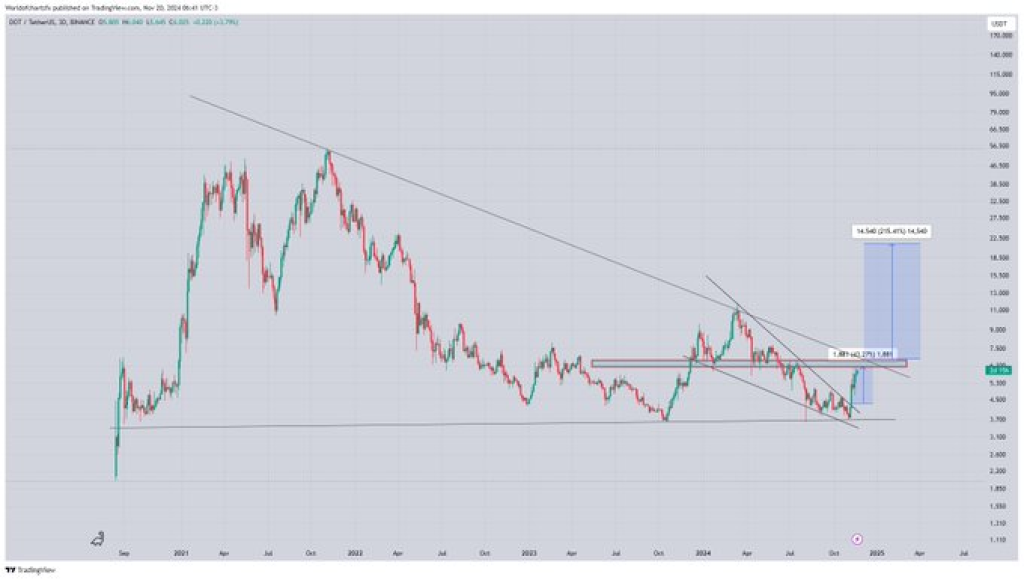
Additionally, a key horizontal resistance zone sits just above the current price, representing a point where selling pressure has previously dominated.
The analysis indicates that if Polkadot can successfully break through both the descending trendline and this horizontal resistance, it may signal a bullish continuation, with a projected price target of $11 to $12 in the upcoming weeks.
Read Also: This Analyst Predicts SUI Price Will Surge to $5 Soon – Here’s Why
The bullish projection zone, illustrated on the chart, aligns with historical resistance levels and suggests a strong potential for growth. The recent rally reflects renewed buying interest as Polkadot rebounds from a significant bottom, indicating a broader market recovery.
A technical perspective suggests two scenarios: DOT could continue its upward movement if it breaks through resistance levels, but failure to do so might trigger a reversal. Market dynamics, including broader economic conditions and Bitcoin’s price action, could affect DOT’s trajectory.
Subscribe to our YouTube channel for daily crypto updates, market insights, and expert analysis.

We recommend eToro
Wide range of assets: cryptocurrencies alongside other investment products such as stocks and ETFs.
Copy trading: allows users to copy the trades of leading traders, for free.
User-friendly: eToro’s web-based platform and mobile app are user-friendly and easy to navigate.