Pi Network price finally broke through some key resistance levels yesterday and is now showing early signs of a short-term shift. After spending several sessions moving sideways, the price jumped and is now hovering around $0.6297, up nearly 9% in the last 24 hours. That breakout caught traders’ attention, though many are still cautious because the technical indicators are sending mixed signals.
Right now, the $0.59 to $0.60 zone has flipped into a support area, and all eyes are on the next resistance level around $0.66. Whether this breakout holds or loses steam will likely become clearer over the next few hours.
What you'll learn 👉
Pi Coin Chart Analysis
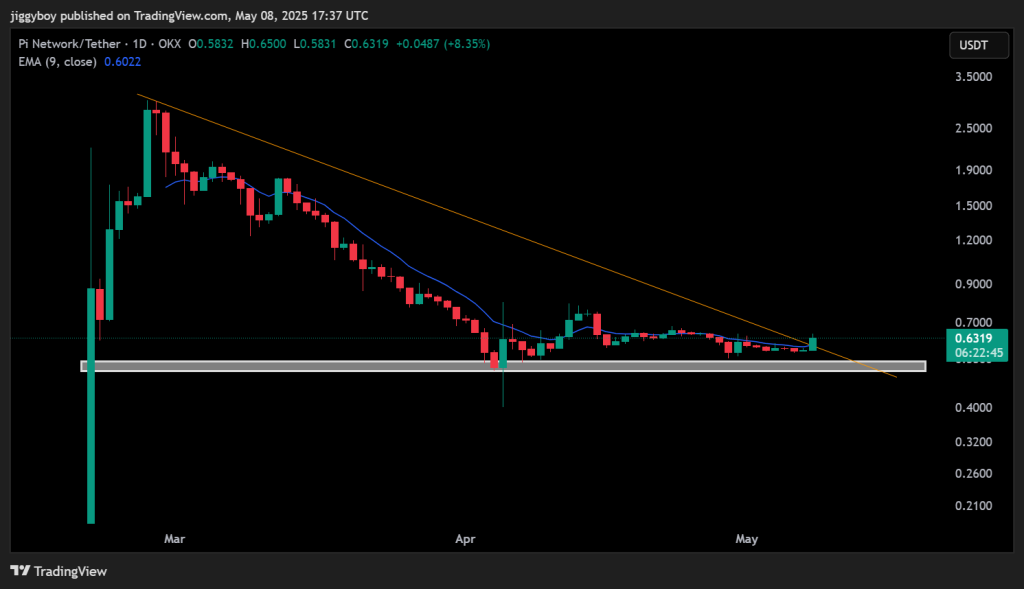
On the daily chart, Pi Coin price has broken above a descending trendline that had kept the price under pressure since March. The bullish daily candle from May 8 also closed above the 9-day EMA, which adds further strength to this move. This technical breakout may mark the beginning of a trend shift if bulls can maintain control.
The $0.56–$0.59 area remains a key support zone. This level was tested several times over the past few weeks, and buyers consistently defended it. The next challenge lies in pushing through the $0.66 level. If price fails to hold above $0.60, there could be a risk of dropping back toward the support range.
Hourly candles leading into May 9 show some hesitation after the breakout. While buyers made a strong move, the market is still digesting this change. Whether bulls follow through or not will depend on volume and momentum over the next few sessions.
Technical Indicators
Here is a snapshot of the current hourly indicators for Pi Coin price:
Read Also: Kaspa at a Major Crossroad Again: Volatility Expected — Where is Price Headed Next?
| Indicator | Value | Signal | What It Suggests |
| MACD | -0.031 | Bearish | Momentum is still weak below the signal line |
| CCI | 39.01 | Neutral | No strong direction, the market is indecisive |
| Ultimate Oscillator | 51.2 | Mild Bullish | Buyers have a slight advantage |
| ROC | -3.135 | Bearish | Price has pulled back slightly after a push |
| Bull/Bear Power | 0.0202 | Bullish | Bulls are showing signs of strength |
| RSI (14, 1H) | 47.08 | Neutral | Momentum is balanced, no clear trend |
Indicators are mixed. MACD and ROC remain bearish, while Ultimate Oscillator and Bull Power suggest mild buyer interest. RSI and CCI stay in the neutral zone, showing that momentum is building but not yet decisive.
Pi Coin Price Prediction for May 9
For today, Pi Coin may attempt to retest the $0.66 resistance level if the price holds above $0.60. A clear move above $0.66 with volume could open the way toward the $0.70–$0.75 range.
On the downside, if the Pi Coin price falls below $0.59, there is a risk of a drop toward $0.56 again. A move below that would invalidate the breakout and bring $0.52 into focus.
The outlook stays neutral to somewhat bullish if price holds above $0.60. Watch the $0.66 level carefully – it’ll likely determine if this breakout can continue upward.
Subscribe to our YouTube channel for daily crypto updates, market insights, and expert analysis.

We recommend eToro
Wide range of assets: cryptocurrencies alongside other investment products such as stocks and ETFs.
Copy trading: allows users to copy the trades of leading traders, for free.
User-friendly: eToro’s web-based platform and mobile app are user-friendly and easy to navigate.