Pi Coin is still feeling the pressure as it struggles to climb above resistance. It looked like things might be settling earlier this week, but the price is once again stuck below some key short-term levels.
At writing, Pi Coin price is trading around $0.5790, slightly down by 0.21% in the past 24 hours. The market’s been pretty quiet, with the price moving in a tight range. Traders seem to be holding off until there’s a clear breakout that shows where the price might head next.
The $0.56 to $0.60 range has become the main battleground. Buyers have done a decent job holding the line at $0.56, but every time the price gets close to $0.59, sellers step in. If either side gives way with volume, we could finally see some direction.
What you'll learn 👉
Pi Coin Chart Analysis
On the daily chart, Pi Coin price has been in a prolonged downtrend since March. A descending trendline has formed a strong ceiling for price, consistently pushing it lower with each failed breakout. Price is also trading below the 9-day EMA, which is around $0.5940. This moving average is acting as dynamic resistance and has capped any upward movement in recent sessions.
Support sits firmly around the $0.56 mark, a level that has been tested multiple times since early April. If the price falls below this support, the next zones to watch are $0.52 and possibly $0.48. On the upside, a breakout above both the trendline and EMA could shift momentum, opening room for a move toward $0.63 or even $0.66.
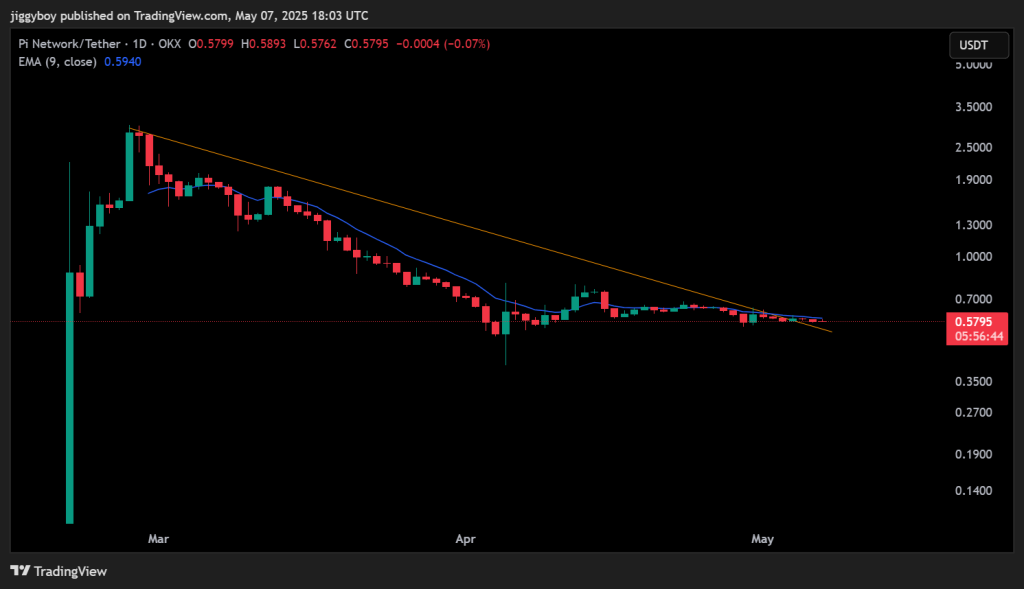
The candlesticks over the past few days have been small and range-bound, signaling low volatility and indecision. This type of compression often leads to a sharp breakout, but the direction remains unclear at this point.
Technical Indicators
Here is a quick overview of some key hourly indicators for Pi Coin:
| Indicator | Value | Signal | What It Suggests |
| MACD (12,26) | -0.039 | Bearish | Momentum is still in favor of sellers |
| CCI (14) | -92.79 | Bearish | Nearing oversold, but no reversal yet |
| Ultimate Oscillator | 36.97 | Weak | Low buying pressure |
| ROC (Rate of Change) | -12.669 | Bearish | Price has dropped sharply |
| Bull/Bear Power (13) | -0.0405 | Bearish | Bears have control over short-term trend |
| RSI (14) | 37.08 | Slightly Bearish | Momentum is weak but not oversold |
All indicators suggest that the market is still in a bearish phase. The MACD remains negative, while the CCI and ROC confirm weak price strength. The RSI is near 37, showing soft momentum without being fully oversold. There is no strong buy signal yet, and sellers are slightly ahead in this timeframe.
Read Also: Crescendo Upgrade Fuels Hype as Kaspa Eyes First Big Exchange Listing
Pi Coin Price Prediction for May 8
Today, Pi Coin is likely to remain within its current range unless a clear breakout occurs. If the price can push above $0.5940 and break the descending trendline, it could move toward $0.63. This would be the first sign of a possible short-term recovery. A move beyond that might target the $0.66 area.
However, if the price slips below $0.56 support, Pi Coin price could drop quickly toward $0.52 or even lower. With the chart showing tightening price action and technical indicators favoring sellers, the short-term outlook leans slightly bearish.
The key levels to watch today are $0.56 on the downside and $0.594 on the upside. A decisive move in either direction will likely set the tone for the next few days.
Subscribe to our YouTube channel for daily crypto updates, market insights, and expert analysis.

We recommend eToro
Wide range of assets: cryptocurrencies alongside other investment products such as stocks and ETFs.
Copy trading: allows users to copy the trades of leading traders, for free.
User-friendly: eToro’s web-based platform and mobile app are user-friendly and easy to navigate.