Pi Coin remains stuck in a tight trading range, with the price continuing to compress as volatility drops. At writing, Pi Coin price is trading at around $0.5866, down nearly 1% in the last 24 hours. The market is indecisive, with neither buyers nor sellers gaining strong control.
The range between $0.580 and $0.600 has become a key decision zone. Price is approaching the apex of a descending triangle, which usually leads to a breakout, either to the upside or a continuation lower.
What you'll learn 👉
Pi Coin Chart Analysis
On the 4-hour chart, Pi Coin price is forming a descending triangle pattern. This is a bearish setup unless price breaks above the descending trendline, which has been pushing lower highs since mid-April. The trendline currently aligns with the $0.60–$0.615 resistance zone.
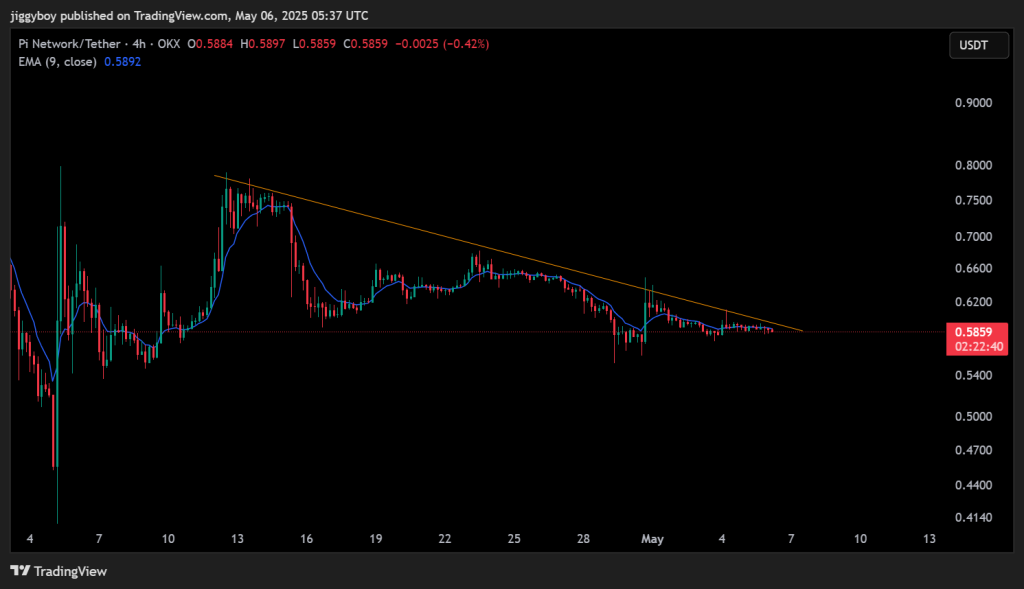
Support continues to hold between $0.575 and $0.580. This zone has been tested several times and remains a strong area for buyers to step in. However, the price is hovering just below the 9-period EMA, which sits at $0.5892. Staying under this line keeps the short-term bias slightly bearish.
The candles from early May have become smaller and tighter, showing a clear drop in momentum. This low-volatility phase suggests that a larger move may be forming for Pi Coin price. But the chart still offers no confirmed breakout in either direction.
Technical Indicators
Here is a quick overview of some key hourly indicators for Pi Coin:
| Indicator | Value | Signal | What It Suggests |
| MACD (12,26) | -0.001 | Bearish | Momentum is slightly negative |
| CCI (14) | -36.13 | Neutral | Mild downward pressure, no strong trend |
| Ultimate Oscillator | 48.94 | Bearish | Weak buying interest |
| ROC (Rate of Change) | -0.204 | Bearish | Price is slowly declining |
| Bull/Bear Power (13) | -0.0002 | Bearish | Bears have a slight edge |
| RSI (14, 1H) | 45.73 | Neutral | Market is undecided |
Most indicators continue to show either neutral or bearish signals. The MACD and ROC are in negative territory, indicating slow downward momentum. The RSI is below 50, suggesting soft momentum without confirming an oversold condition. Overall, the technical setup leans slightly bearish but without strong conviction.
Pi Coin Price Prediction for May 6
For today, the price will probably remain within the narrow $0.580 to $0.600 range unless a definitive breakout occurs. In case of an increase in Pi Coin price above $0.600 on high volume, it can test the $0.615 mark. This would mark a shift toward short-term bullish momentum. A further move might reach $0.628.
If the price fails to hold $0.580, the next support lies at $0.565. A break below that could accelerate the drop toward $0.550. The overall trend remains weak, and traders should continue monitoring the $0.600 zone closely. This level is likely to determine the next direction in Pi Coin’s short-term price action.
Subscribe to our YouTube channel for daily crypto updates, market insights, and expert analysis.

We recommend eToro
Wide range of assets: cryptocurrencies alongside other investment products such as stocks and ETFs.
Copy trading: allows users to copy the trades of leading traders, for free.
User-friendly: eToro’s web-based platform and mobile app are user-friendly and easy to navigate.