
Pi Coin continues to lose ground as it trades at $0.6798, down 5.70% over the past day. After multiple failed attempts to break above its descending trendline, the token is now moving closer to a critical support zone. With volume up by 36.23%, market activity has picked up, but not yet in the bulls’ favor.
Let’s break down today’s outlook.
What you'll learn 👉
📅 What We Got Right Yesterday
In yesterday’s forecast, the Pi Coin price outlook suggested three potential paths: consolidation, breakout, or breakdown. We warned that a move below $0.70 could expose the price to further downside toward the $0.60–$0.66 region. That bearish setup has now started to play out.
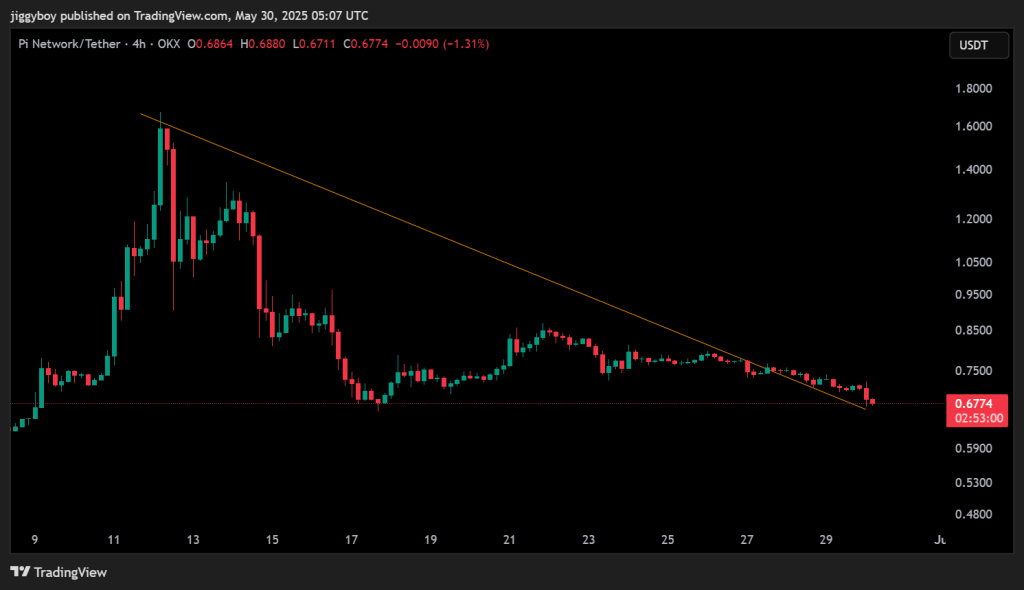
The price briefly tested the descending trendline, failed to break through, and reversed with a sharp move down. The technical rejection at that level confirmed that bearish pressure is still in control. The $0.66 support zone is now being closely watched, as it has held in several past sessions but is under renewed stress.
📊 Pi Coin Daily Overview (May 30)
- Current Price: $0.6798
- 24h Change: -5.70%
- 4H RSI: 24.65 (Oversold)
- Volume: Higher than previous sessions (+36.23%)
The Pi Coin price chart displays a continued series of lower highs and lower lows, forming a descending triangle pattern. This setup typically favors a breakdown unless bulls can quickly reclaim higher territory. The key resistance remains around $0.73–$0.75, while the nearest support sits at $0.66.
🔍 What the Pi Coin Chart Is Showing
The 4H chart confirms the dominance of sellers. Each price bounce has been weaker than the last, and the descending trendline remains intact. The current breakdown attempt is the third test of the $0.66–$0.67 support area.
The rejection from the trendline aligns with a drop in buying interest and an uptick in bearish momentum. While volume has increased, it appears to be driven more by sell orders than accumulation. Without a shift in trend structure or a confirmed bullish divergence, downside risk remains elevated.
📈 Technical Indicators (Hourly Timeframe)
| Indicator | Value | Signal / Interpretation |
| RSI (14) | 24.65 | Deeply oversold, selling may be overextended |
| ADX | 28.03 | Strong trend strength, bearish trend in control |
| MACD (12,26) | -0.011 | Bearish crossover, momentum favors sellers |
| CCI (14) | -148.49 | Strong bearish bias |
| Ultimate Oscillator | 35.65 | Weak buying pressure |
| ROC | -4.109 | Sharp negative momentum |
| Bull/Bear Power (13) | -0.0383 | Bears dominate, continued downside pressure |
Most indicators continue to reflect a bearish bias with no short-term signs of a reversal.
🔮 Pi Coin Price Prediction Scenarios
Bullish Scenario: If Pi Coin manages to break above $0.73–$0.75 with strong volume, it could retest the $0.80–$0.85 zone.
Neutral Scenario: If support at $0.66 holds, sideways consolidation between $0.66 and $0.73 could continue.
Bearish Scenario: A breakdown below $0.66 may push the price further down to $0.60 or even $0.55, especially if volume increases on the sell side.
Moreover, the bearish structure remains intact as Pi Coin price struggles to hold support near $0.66. Hourly indicators show strong downside momentum, and the descending triangle pattern signals caution. Unless bulls step in quickly with volume and reclaim the $0.73 range, Pi Coin could continue sliding lower in the short term.
Read Also: ONDO Ready for 4x Explosion? Chart Shows Buy Opportunity Before Major Breakout
Subscribe to our YouTube channel for daily crypto updates, market insights, and expert analysis.

We recommend eToro
Wide range of assets: cryptocurrencies alongside other investment products such as stocks and ETFs.
Copy trading: allows users to copy the trades of leading traders, for free.
User-friendly: eToro’s web-based platform and mobile app are user-friendly and easy to navigate.