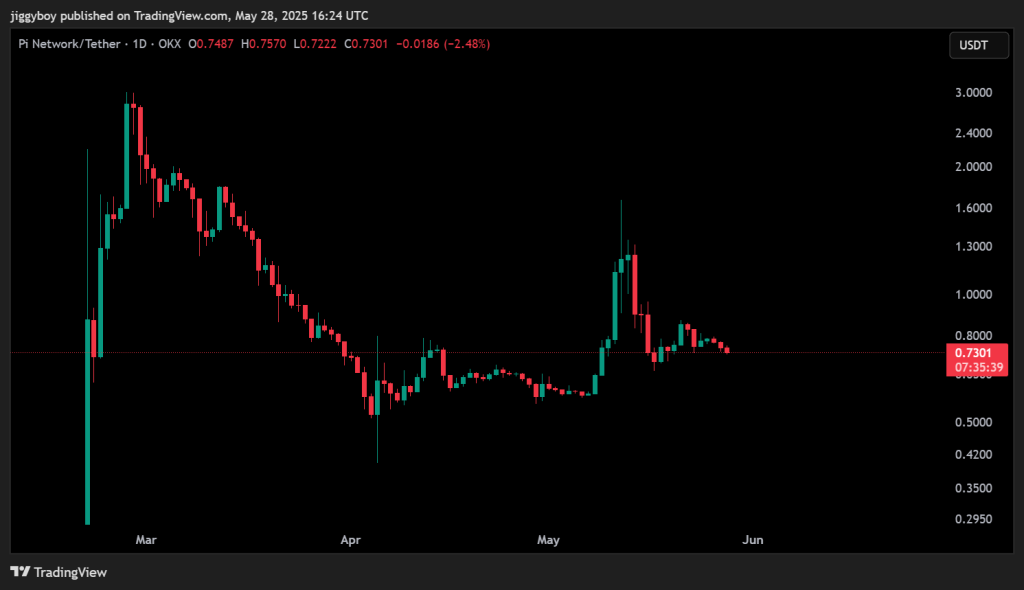
Pi Network continues to trade in a narrow band following its sharp pullback earlier this month. After hitting a local peak around $1.65 in early May, the token has lost momentum and is now hovering just below $0.73. Market conditions remain uncertain, with sellers showing renewed pressure and key indicators flashing mixed signals.
Let’s break down today’s outlook.
What you'll learn 👉
📅 What We Got Right Yesterday
In yesterday’s forecast, we noted that Pi Coin price was at risk of falling back toward the $0.72–$0.70 range if it failed to hold above $0.74. That scenario played out as expected. Pi Network slipped to the lower end of its range during the day, facing rejection near resistance at $0.75.
We also projected a potential continuation of sideways movement in the $0.73–$0.77 zone if buying pressure didn’t return. As of now, that range is still valid, with volume declining and traders appearing cautious.
📊 Pi Coin Daily Overview (May 29)
- Current Price: $0.7290
- 24h Change: -3.11%
- 4H RSI: 46.43
- Trading Volume: Down 32.23% compared to the previous day
The Pi Coin price is consolidating near the $0.73 zone. Lower highs have formed since mid-May, with a descending triangle pattern emerging on the daily chart. Support between $0.70 and $0.73 has held so far, but the weakening volume suggests reduced interest from buyers.
🔍 What the Pi Coin Chart Is Showing
Pi Coin remains in a cooling phase. After its rally earlier in May, the token has steadily moved lower within a tightening formation. The descending triangle pattern indicates potential downside risk if support fails.
While the current structure is still intact, the lack of momentum points to indecision. Volume remains light, and candles are showing limited strength. Any break below $0.70 could trigger a sharper move lower, potentially toward $0.60.
Read Also: We Asked AI to Predict Hedera (HBAR) Price in June
📈 Technical Indicators (Daily Timeframe)
| Indicator | Value | Interpretation |
| MACD (12,26) | +0.01 | Weak bullish crossover |
| ADX | 29.33 | Strong trend, bearish direction |
| CCI (14) | -93.13 | Bearish bias, near oversold |
| Ultimate Oscillator | 40.17 | Mild bearish pressure |
| RSI (14) | 46.43 | Neutral momentum |
| ROC | -18.91 | Bearish trend, strong selling pace |
| Bull/Bear Power (13) | -0.0654 | Sellers are dominant |
Summary: Momentum remains weak overall. Most indicators lean bearish, with only the MACD hinting at early bullish divergence. RSI is neutral, and no strong reversal signs have formed yet.
🔮 Pi Coin Price Prediction Scenarios
Bullish Scenario: A break above $0.77 with volume could send Pi Coin price toward $0.80–$0.85. The setup needs stronger market participation.
Neutral Scenario: Continued consolidation between $0.70 and $0.77 is likely if neither bulls nor bears gain control.
Bearish Scenario: A move below $0.70 may accelerate downside toward $0.60, especially if selling volume increases.
Pi Coin price is currently trading within a fragile structure, with no strong trend confirmed. Indicators favor sellers, and price remains under pressure. For now, the most probable outcome is sideways movement unless $0.70 breaks or a breakout above $0.77 materializes with clear volume support.
Subscribe to our YouTube channel for daily crypto updates, market insights, and expert analysis.

We recommend eToro
Wide range of assets: cryptocurrencies alongside other investment products such as stocks and ETFs.
Copy trading: allows users to copy the trades of leading traders, for free.
User-friendly: eToro’s web-based platform and mobile app are user-friendly and easy to navigate.