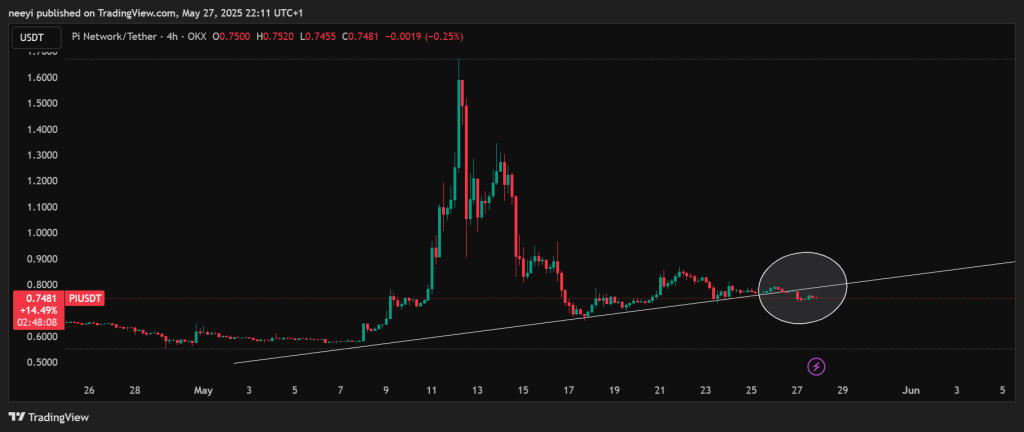
Pi coin has been showing more weakness after it failed to hold above a key trendline support. The price broke below that level two days ago and then tried to bounce, but it only managed to retest the old support as resistance. This happened at around $0.77 on the 4-hour chart. After failing to break higher, Pi price declined further yesterday, touching around $0.73 before eventually closing near $0.74.
In yesterday’s analysis, we noted that Pi coin price could trade between $0.73 and $0.78 if it doesn’t break above the resistance. And that is exactly what played out. So now, the big question is, what’s next?
Let’s take a look at what the indicators are showing.
What you'll learn 👉
Technical Indicators: What the Signals Are Telling Us
According to the latest 5-hour chart on Investing.com, most of the technical indicators are leaning towards bearish sentiment. Here is a summary of their readings:
| Indicator | Value | Interpretation |
|---|---|---|
| Relative Strength Index (RSI 14) | 47.426 | Neutral — RSI shows neither overbought nor oversold conditions |
| Stochastic Oscillator (STOCH 9,6) | 39.83 | Sell — Suggests downward momentum is likely continuing |
| Moving Average Convergence Divergence (MACD 12,26) | -0.015 | Sell — Indicates bearish momentum is in control |
| Ultimate Oscillator | 44.758 | Sell — Suggests sellers are more dominant in the short term |
| Rate of Change (ROC) | -0.245 | Sell — Shows a slight negative momentum |
| Bull/Bear Power (13) | 0.014 | Buy — Shows bulls are still trying to fight back, but the signal is very weak |
Overall, most of these point to bearish pressure building on Pi coin price, especially as it continues to trade below short-term resistance levels.
Moving Averages Show More Downside Risk
The moving averages add more context to the technical picture. Both the simple and exponential moving averages across key time frames are showing weakness.
| Moving Average | Simple MA | Signal | Exponential MA | Signal |
|---|---|---|---|---|
| MA50 | 0.8214 | Sell | 0.7921 | Sell |
| MA100 | 0.7983 | Sell | 0.7907 | Sell |
| MA200 | 0.7196 | Buy | 0.8078 | Sell |
This shows that the Pi coin price is below most short- and mid-term averages, which signals continued bearishness. The only bright spot is that the simple MA200 is still below current prices, suggesting some long-term support may exist near $0.72.
Pi Coin Price Prediction for May 28
Given the current market setup, there are three possible directions Pi coin could take today:
Bearish Scenario:
If Pi fails to hold above $0.74 and sellers take control again, the price could fall back toward $0.72 or even test the $0.70 zone, which would align with the bearish signals from indicators and moving averages.
Neutral Scenario:
Pi may stay in consolidation mode and trade sideways between $0.73 and $0.77. This would happen if traders are indecisive and volume remains low.
Bullish Scenario:
If Pi coin manages to reclaim the $0.77 level and pushes above it with strong momentum, then we could see it test $0.80 again. This would require a sudden change in market sentiment or strong buying pressure.
Read Also: Can Kaspa Be the Biggest Gainer This Bull Run? Analyst Makes Bold KAS Comparison
Right now, Pi coin is showing signs of weakness, especially after losing key support levels and failing to bounce strongly. Most indicators and moving averages suggest that downward pressure is still strong. However, there is still some long-term support beneath current levels. A decisive move above $0.77 would flip the short-term outlook, but unless that happens, the bias for today remains cautious to bearish.
Subscribe to our YouTube channel for daily crypto updates, market insights, and expert analysis.

We recommend eToro
Wide range of assets: cryptocurrencies alongside other investment products such as stocks and ETFs.
Copy trading: allows users to copy the trades of leading traders, for free.
User-friendly: eToro’s web-based platform and mobile app are user-friendly and easy to navigate.