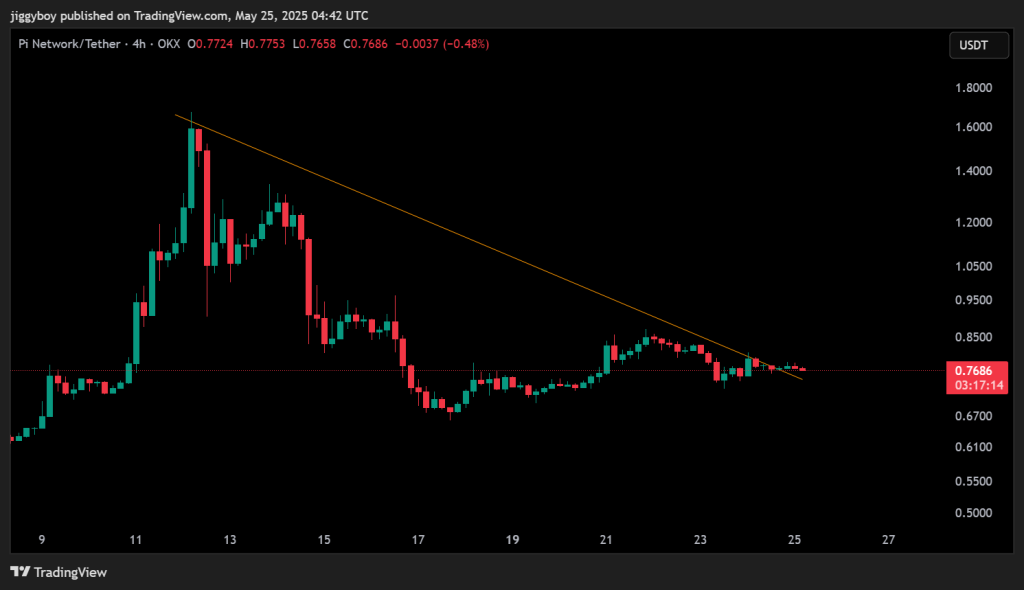
Pi Coin continues to trade within a narrowing range as it tests a key resistance trendline. After surging to nearly $1.75 earlier this month, the Pi Network price has steadily pulled back and is now trading at $0.7677, down almost 3% over the past day. With volume down over 60% and most indicators flashing red, the token appears stuck in consolidation, but a decisive move could be coming.
Let’s break down today’s outlook.
What you'll learn 👉
📅 What We Got Right Yesterday
In yesterday’s prediction, the expected range of $0.74 to $0.79 played out almost perfectly. Pi Coin price spent the day hovering just below the $0.78 resistance zone, showing no signs of a breakout and avoiding a major breakdown.
Our neutral scenario predicted price stability within the $0.75 to $0.78 range, and that’s exactly where the token spent most of the session. The absence of market-moving news and weak volume kept momentum muted throughout the day.
📊 Pi Coin Daily Overview (May 25)
- Current Price: $0.7677
- 24h Change: -2.96%
- 4H RSI: 42.38
- Volume: Significantly lower than earlier in May
Pi Coin price is now sitting just beneath a long-standing descending trendline, with price action compressing into a tighter zone. The support area remains between $0.73 and $0.74, while resistance holds at $0.78. A breakout above that level could suggest a shift in sentiment, but for now, the trend remains cautious.
🔍 What the Pi Coin Chart Is Showing
The 4H chart confirms a descending triangle pattern, a bearish structure unless invalidated by a strong breakout. Since May 11, Pi Coin price has posted lower highs and failed breakout attempts. Today, the price is again testing the top of the triangle, but without the volume or strength needed to break through.

The triangle formation implies reduced volatility and a likely breakout soon. Whether that’s to the upside or downside will depend on broader market trends and potential catalysts. Until then, the price may continue to bounce between $0.74 and $0.78.
📈 Technical Indicators (Hourly Timeframe)
| Indicator | Value | Signal / Interpretation |
| RSI (14) | 42.385 | Weak momentum, neutral-to-bearish |
| ADX | 28.964 | Trend gaining strength, direction bearish |
| MACD | -0.001 | Mild bearish crossover |
| CCI | -95.904 | Approaching oversold |
| Ultimate Oscillator | 35.695 | Bearish pressure |
| ROC (Rate of Change) | -0.4 | Mild downward movement |
| Bull/Bear Power (13) | -0.0101 | Slight bullish divergence, not confirmed |
Summary: Most hourly indicators are bearish. There’s a minor divergence in Bull/Bear Power, but the overall setup favors the downside unless volume picks up.
Read Also: Is Cardano in Trouble After Another 11% Crash? ADA Price Outlook
🔮 Pi Coin Price Prediction Scenarios
Bullish Scenario: A confirmed breakout above $0.78 with a strong 4H candle close could push Pi Network toward $0.85, with potential for $0.90 if volume expands.
Neutral Scenario: Price holds between $0.73 and $0.78, continuing range-bound consolidation as traders wait for a clear trend.
Bearish Scenario: A drop below $0.73 could trigger a fall to $0.70 or even $0.65, especially if volume spikes on red candles.
🧠 Wrapping Up
Pi Coin price is coiling beneath descending resistance, and while volatility is low, a sharp move could be approaching. Today’s outlook favors more sideways movement unless bulls can push through $0.78 with conviction.
Short-term traders should closely monitor the $0.73 support and $0.78 resistance. A decisive break on either side will likely set the tone for the next leg.
Subscribe to our YouTube channel for daily crypto updates, market insights, and expert analysis.
We recommend eToro
Wide range of assets: cryptocurrencies alongside other investment products such as stocks and ETFs.
Copy trading: allows users to copy the trades of leading traders, for free.
User-friendly: eToro’s web-based platform and mobile app are user-friendly and easy to navigate.


