Pi Coin extended its recovery on Wednesday, building on the bounce that started near $0.70 earlier this week. After an 11.56% jump over the past day, the token is now trading around $0.8250. This move was supported by a 215% surge in trading volume, suggesting growing interest among short-term traders. But is this the beginning of a new leg up, or just a relief rally?
Let’s break down today’s outlook.
What you'll learn 👉
📅 What We Got Right Yesterday
In our previous outlook, we highlighted three possible scenarios for Pi Coin price movement: bullish continuation above $0.75, bearish pressure below $0.69, and a neutral range between $0.69 and $0.75. The bullish case played out, as Pi held above key support and broke through the $0.75 level.
Momentum indicators such as MACD and ROC aligned with this move, and we noted that a close above $0.75 could lead to a push toward $0.80. Pi went further, touching an intraday high of $0.8558.
📊 Pi Coin Daily Overview (May 22)
- Current Price: $0.8250
- 24h Change: +11.56%
- 4H RSI: 42.88
- Volume: Up 215.99%
Pi Coin price continues to trade above the $0.70–$0.73 support band, with fresh buying pressure lifting it to near-term highs. The daily candles are now showing stronger bodies, hinting at increased confidence from bulls after a period of sideways action.
🔍 What the Pi Coin Chart Is Showing
The daily chart confirms a short-term recovery trend. After a full correction from the $1.70 high, Pi formed a base around $0.70 and began climbing. This bounce comes after weeks of lower lows and sideways consolidation.
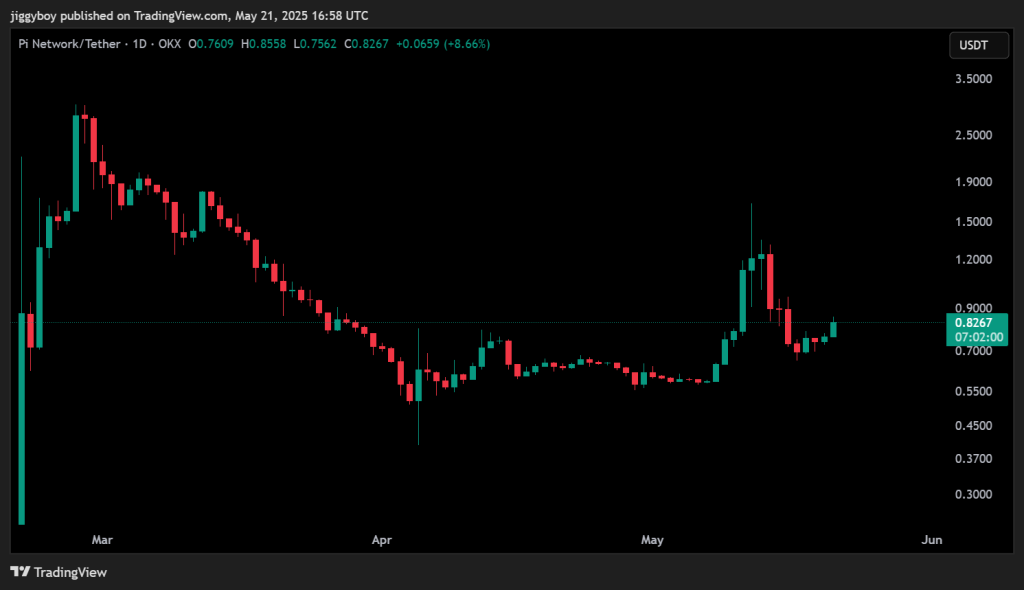
Resistance remains in the $0.90–$1.00 zone, where Pi Network price last faced strong rejection in early May. A clean break above that area could open the path toward $1.40–$1.70, though that would likely require sustained volume and stronger confirmation from broader market trends.
📈 Technical Indicators (Daily Timeframe)
| Indicator | Value | Signal / Interpretation |
| RSI (14) | 53.152 | Neutral, no extreme momentum |
| MACD (12,26) | 26.012 | Buy, bullish crossover in place |
| CCI (14) | -13.0844 | Neutral, trend undecided |
| Ultimate Oscillator | 47.625 | Slight Sell, fading bullish momentum |
| ROC (Rate of Change) | 42.399 | Buy, strong positive momentum |
| Bull/Bear Power (13) | 0.0118 | Buy, bulls have regained slight control |
Summary: Most indicators are tilting bullish. MACD, ROC, and Bull/Bear Power support further upside. However, neutral RSI and CCI suggest that the trend needs more confirmation before a full breakout can occur.
🔮 Pi Coin Price Prediction Scenarios
Bullish Scenario: If Pi Coin holds above $0.80 and breaks through $0.90, the next resistance zone lies between $1.00 and $1.40.
Neutral Scenario: If price remains between $0.75 and $0.85 without volume growth, expect sideways action to continue.
Bearish Scenario: A move back below $0.73 could retest the $0.70 support. If that fails, Pi Coin price may drop to $0.65 in the short term.
🧠 Wrapping Up
Pi Coin is attempting to regain lost ground after a sharp May pullback. The technical setup shows early signs of strength, especially as trading volume increases. However, without a firm break above $0.90, this could still be a lower high within a broader range.
Traders should continue watching the $0.70 support zone and $0.90 resistance level for directional cues. Until either breaks, expect choppy action within the range.
Read Also: Here’s Why Dogwifhat (WIF) Price Is Pumping
Subscribe to our YouTube channel for daily crypto updates, market insights, and expert analysis.

We recommend eToro
Wide range of assets: cryptocurrencies alongside other investment products such as stocks and ETFs.
Copy trading: allows users to copy the trades of leading traders, for free.
User-friendly: eToro’s web-based platform and mobile app are user-friendly and easy to navigate.