
Pi Coin is starting the week with slow momentum following a dramatic price rollercoaster earlier this month. After peaking at nearly $1.75 on May 11, the token has corrected sharply and is now trading just above $0.73. The recent action shows signs of exhaustion, but key indicators suggest that buyers may still be hanging on – for now.
Let’s break down today’s outlook.
What you'll learn 👉
📅 What We Got Right Yesterday
In yesterday’s Pi Coin outlook, we emphasized the importance of the $0.70 support zone and noted that the price was likely to enter a phase of sideways consolidation unless bulls regained strength. That’s exactly what played out — Pi held above $0.70 and moved in a tight range between $0.72 and $0.75 throughout the day.
We also highlighted reduced momentum across multiple indicators, suggesting no immediate breakout. That analysis still holds as we head into today’s session.
📊 Pi Coin Daily Overview (May 20)
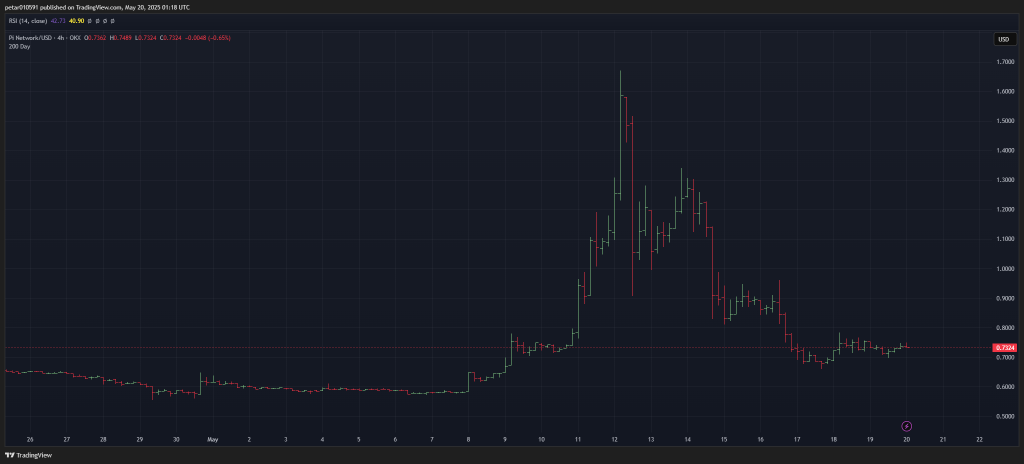
- Current Price: $0.7324
- 24h Change: -0.65%
- 4H RSI: 42.73
- Volume: Lower compared to peak breakout days
The price has been consolidating in a narrow range over the past few days, with short candles and lower wicks indicating a lack of directional conviction. A key support level is forming around $0.70, while the resistance zone sits between $0.80 and $0.85.
🔍 What the Pi Coin Chart Is Showing
The 4-hour chart reveals that Pi Coin is in a cooling-off phase. After its parabolic run earlier in May, the token has slowly bled down toward a support band at $0.70–$0.72. Volume has dropped considerably, and the price action has flattened – a sign that the market is waiting for a new catalyst.
Despite the bearish retracement, there’s no clear breakdown yet. As long as the $0.70 level holds, there’s room for consolidation before the next leg.
📈 Technical Indicators (Daily Timeframe)
| Indicator | Value | Signal / Interpretation |
|---|---|---|
| MACD | +0.032 | Mild bullish crossover, weak momentum |
| ADX | 27.41 | Moderate trend strength, fading |
| CCI | -37.03 | Slight bearish pressure |
| Highs/Lows | -0.003 | Flat structure, no breakout or breakdown |
| Ultimate Oscillator | 36.83 | Weak buying interest |
| ROC (Rate of Change) | 26.88 | Strong bullish momentum (Buy signal) |
| Bull/Bear Power | -0.101 | Slight bearish dominance |
Summary: Most indicators suggest mild bearish-to-neutral sentiment. The ROC stands out with bullish momentum, but without confirmation from MACD or volume, it’s not enough to signal a breakout on its own.
🔮 Pi Coin Price Prediction Scenarios
- Bullish Scenario: If Pi Coin breaks above $0.80–$0.85 with strong volume, a rally toward $0.95–$1.05 becomes possible.
- Neutral Scenario: If Pi Coin holds above the $0.70 support, expect sideways movement between $0.70 and $0.80.
- Bearish Scenario: A breakdown below $0.70 could send the price down to $0.65 or even $0.60 in the short term.
🧠 Wrapping Up
Pi Coin is clearly no longer in the explosive phase we saw two weeks ago. Momentum has cooled, and indicators show mixed signals. The market is likely waiting for either a new announcement or stronger buying interest before making its next move.
If you’re a short-term trader, keep a close eye on the $0.70 support zone. A daily close below that level could open the door to a deeper correction. On the flip side, a surge above $0.85 with volume could revive the bullish setup.
For today, the most likely path is continued sideways chop, unless buyers show renewed strength by U.S. market hours.
Subscribe to our YouTube channel for daily crypto updates, market insights, and expert analysis.

We recommend eToro
Wide range of assets: cryptocurrencies alongside other investment products such as stocks and ETFs.
Copy trading: allows users to copy the trades of leading traders, for free.
User-friendly: eToro’s web-based platform and mobile app are user-friendly and easy to navigate.