Pi Coin is trading at $0.7332 today, up 0.55% over the past day. Volume has also climbed 26.44%, hinting at some renewed trading activity. Still, the token remains in a tight range after last week’s volatile swings, with no clear direction emerging yet.
The current price action follows a steep correction after Pi Coin price surged to nearly $1.70 between May 9 and May 13. Since then, it has slipped back under its 50-period moving average and is now hovering just above a short-term support level around $0.70.
What you'll learn 👉
What the Pi Coin Chart Is Showing
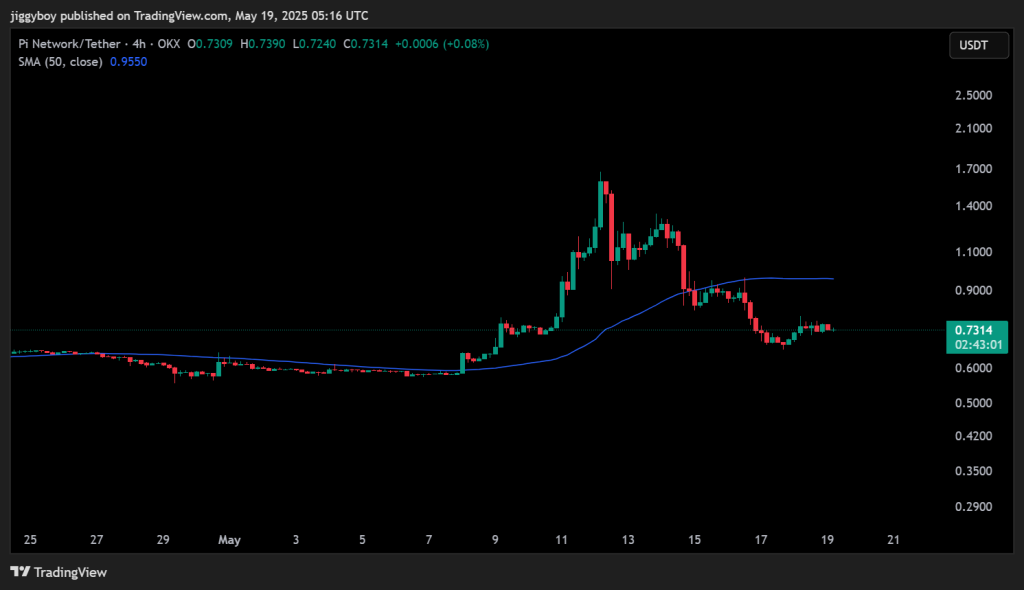
The 4-hour chart shows a textbook boom-and-bust pattern. After consolidating under $0.70 for weeks, Pi Network exploded to the upside, hitting a local high near $1.700. But the rapid climb was followed by an equally aggressive drop, pushing the token back under its 50 SMA around $0.95.
At the moment, the Pi Coin price is consolidating around $0.73. The area between $0.70 and $0.73 is acting as temporary support. Bulls need to hold this level to avoid a deeper pullback. If the token fails to reclaim $0.75 soon, bears could regain control and send the price lower. Resistance remains in the $0.95–$1.00 range, which also aligns with the 50 SMA.
Technical Indicators (Hourly Timeframe)
| Indicator | Value | Interpretation |
| RSI (14) | 49.415 | Neutral momentum |
| MACD (12,26) | 0.005 | Mild bullish signal |
| CCI (14) | -66.86 | Light downward pressure |
| Ultimate Oscillator | 45.73 | Weak buying interest |
| ROC | -1.94 | Negative short-term momentum |
| Bull/Bear Power (13) | -0.0127 | Slight bear dominance |
Read Also: Ripple President: Bank of America Is Going “All In” on XRP – Is This the Start of a Global Shift?
Indicator Analysis
RSI sits just under 50, suggesting that the market is undecided. The MACD is barely positive, pointing to a small bullish divergence, but it lacks strong conviction. Meanwhile, the CCI, Ultimate Oscillator, ROC, and Bull/Bear Power all lean bearish, indicating fading momentum.
The combination of neutral RSI and weak momentum indicators signals a potential pause or continuation of the sideways movement unless volume surges again.
Pi Coin Price Forecast for Today (May 19)
1. Pessimistic Case
- Target: $0.62–$0.65
- If Pi Network price drops below $0.71, the recent bounce may be invalidated. This could lead to another leg down toward lower support, continuing the correction.
2. Realistic Case
- Target: $0.74–$0.76
- A sideways move above $0.71 remains the most likely outcome. Momentum indicators are weak, but support is holding for now.
3. Optimistic Case
- Target: $0.82–$0.88
- If bulls can push through $0.75 with conviction and trading volume continues to rise, Pi Coin price could retest previous short-term highs.
What We Got Right Yesterday
In the May 18 forecast, we highlighted $0.71 as a key level to watch. We noted that consolidation was likely, with a realistic range of $0.74–$0.76. That’s exactly where the market is trading now.
Moreover, the MACD hinted at a slight bullish bias, but overall indicators remained weak, correctly pointing toward a neutral-to-cautious setup. So far, the Pi Network price has respected this zone, with neither bulls nor bears taking full control.
Subscribe to our YouTube channel for daily crypto updates, market insights, and expert analysis.

We recommend eToro
Wide range of assets: cryptocurrencies alongside other investment products such as stocks and ETFs.
Copy trading: allows users to copy the trades of leading traders, for free.
User-friendly: eToro’s web-based platform and mobile app are user-friendly and easy to navigate.