Pi Coin is back on traders’ radar after a weekend marked by declining momentum and tight price action. After briefly spiking to around $1.60 during last week’s Consensus 2025 buzz, the token has since pulled back sharply, dropping below $0.75 before finding some footing. As of writing, Pi Coin price trades at $0.7280, showing a modest 3% daily gain.
However, trading volume is down by more than 52%, suggesting that the current recovery may lack strong conviction from market participants. Despite the wedge breakout visible on the 4-hour chart, technical indicators still lean bearish, raising doubts about the sustainability of the bounce.
What you'll learn 👉
What the Pi Coin Chart Is Showing
The 4-hour chart shows a falling wedge pattern, typically a bullish signal. Pi Coin price has recently pushed above the upper trendline, which could hint at a breakout. The support zone at $0.70–$0.72 has held so far, allowing the current recovery.
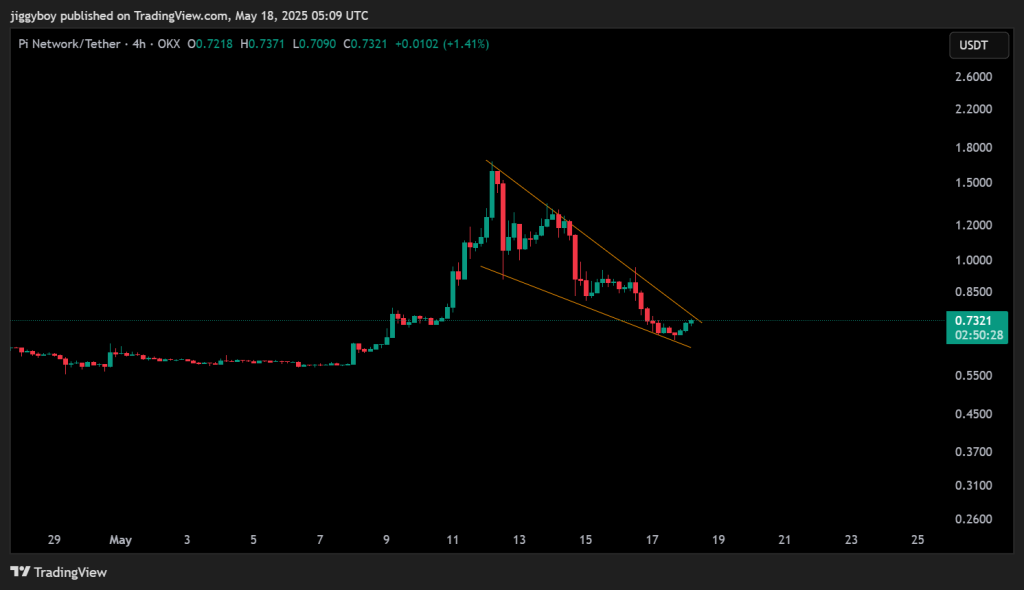
However, overhead resistance near $0.75–$0.80 remains untested. Bulls will need to reclaim this zone with strong volume to shift momentum. A rejection here could send Pi Coin back toward the $0.62–$0.65 region. Meanwhile, historical support around $0.55–$0.60 still stands as a lower defense level if bearish pressure resumes.
Technical Indicators (Hourly Timeframe)
| Indicator | Value | Interpretation |
| 📉 RSI (14) | 38.56 | Bearish momentum, not yet oversold |
| 🧲 MACD (12,26) | -0.059 | Bearish crossover, trend still weak |
| 📉 CCI (14) | -65.48 | Mild bearish bias |
| 💡 Ultimate Oscillator | 46.24 | Slight bearish pressure |
| 🔻 ROC | -13.87 | Strong negative momentum |
| 🐻 Bull/Bear Power (13) | -0.1519 | Bears hold the edge |
Indicator Analysis (Textual)
RSI and CCI both reflect weak momentum, with no signs of deep oversold conditions. MACD remains negative, confirming ongoing downward pressure. ROC’s sharp decline suggests recent selling has been strong, while Bull/Bear Power leans bearish. The Ultimate Oscillator is just below neutral, showing no clear control by buyers.
Pi Coin Price Forecast for Today (May 18)
1. Pessimistic Case
- Target: $0.62–$0.65
- If Pi Network price fails to stay above $0.71 and dips back inside the wedge, a drop toward lower support is likely. This would reflect another failed breakout attempt.
2. Realistic Case
- Target: $0.74–$0.76
- The most probable path is consolidation just above $0.71. Traders are cautious, and the lack of volume limits the upside.
3. Optimistic Case
- Target: $0.82–$0.88
- If bulls push through $0.75 with strength and reclaim volume, a move to retest previous highs near $0.82 could develop.
What We Got Right Yesterday
In the May 17 Pi Coin price prediction, we highlighted $0.71 as a key zone to watch. We noted that holding above this level could trigger a move toward $0.76 or $0.82, while a break below it would open the door to $0.619.
So far, Pi Coin has respected the $0.71 support, bouncing slightly and testing the wedge breakout zone. While no major rally has followed, the warning about cautious momentum and bearish indicators continues to hold.
Subscribe to our YouTube channel for daily crypto updates, market insights, and expert analysis.

We recommend eToro
Wide range of assets: cryptocurrencies alongside other investment products such as stocks and ETFs.
Copy trading: allows users to copy the trades of leading traders, for free.
User-friendly: eToro’s web-based platform and mobile app are user-friendly and easy to navigate.