
The Pi Network (PI) price has extended its decline, making it the fourth day in a row that the token is trading in red. Over the past four days, the Pi Network price has dropped by around 25% after failing to break through a key trendline resistance. The price has gone from a high of $0.729 to a low of $0.68, with yesterday’s range spanning between $0.74 and $0.68.
Despite the continued downtrend, there’s a glimmer of potential relief. The Pi coin price has now approached a key support level around $0.71. Interestingly, the price managed to close slightly above this mark yesterday, which could hint at a possible bounce.
If buyers step in at this zone, we might see a quick recovery toward $0.82, or at least a retest of the broken trendline. But for the market to truly shift momentum, Pi Network price must break above that trendline. Until then, the general structure remains bearish.
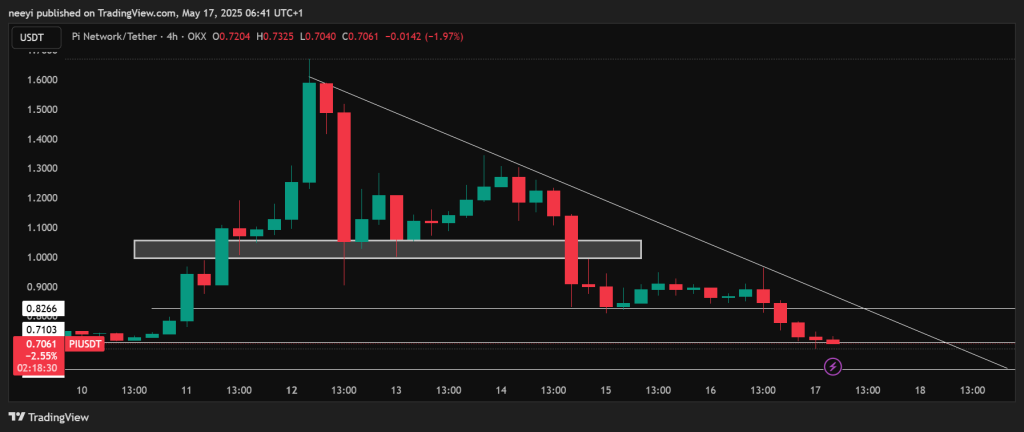
As of writing, PI is trading just around $0.70, and it is flirting with that $0.71 support level. If the price breaks below it decisively, the next major support zone sits around $0.619, and a drop toward that level could unfold fast.
What you'll learn 👉
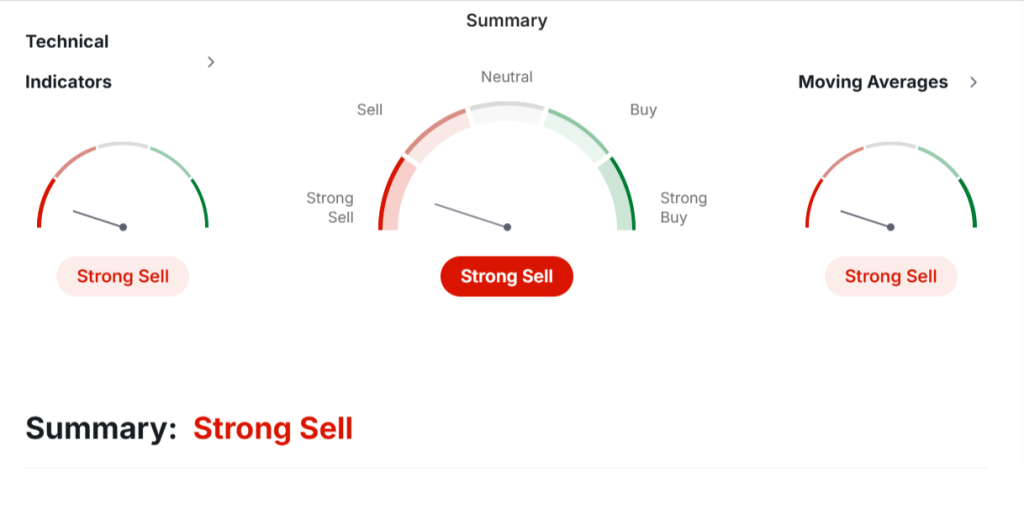
Technical indicators still favor sellers: What this means for PI
Let’s break down the key indicators on the 5-hour chart from Investing.com. These are technical tools that help traders understand market momentum and likely price direction. Here’s what each one tells us right now about the Pi coin price.
RSI (Relative Strength Index): 28.169 – Sell
The RSI measures how overbought or oversold a token is. A value below 30 means the asset is considered oversold. Pi is currently at 28, which means selling has been aggressive. This could either indicate a bounce is near, or the price is just entering a deeper bearish phase.
Stochastic Oscillator: 26.028 – Sell
The Stochastic Oscillator also looks at momentum and whether a coin is overbought or oversold. With a value under 30, it’s showing that Pi Network price is in oversold territory. Again, this usually suggests a potential short-term bounce, but it’s not a guarantee.
MACD (Moving Average Convergence Divergence): -0.039 – Sell
The MACD shows the relationship between two moving averages. A negative value like this signals bearish momentum is still dominant. For Pi, this confirms the downtrend is still in place and momentum favors sellers.
ADX (Average Directional Index): 37.177 – Sell
The ADX measures trend strength. A value above 25 shows the trend is strong, and here it’s 37. That tells us the current bearish move for Pi is solid and likely to continue unless a significant reversal occurs.
ROC (Rate of Change): -15.949 – Sell
This indicator shows how fast price is changing. A negative ROC like this confirms the rapid downward movement in the Pi coin price. It’s one of the clearest signs that sellers are in control.
Bull/Bear Power: -0.0706 – Sell
This indicator compares the strength of bulls versus bears. A negative reading means bears have the upper hand, and right now, that’s the case for Pi.
Moving averages are also sending a strong sell signal. Whether it’s the 20-day, 50-day, 100-day, or even the longer 200-day, both the simple and exponential moving averages are flashing bearish signs. For example, the 20-day simple moving average is at $0.7883 while the current price is nearly $0.70, showing just how deep the token has fallen below key averages.
Pi Coin Price Prediction for Today (May 17)
Given the current technical indicators and the bearish structure of the Pi Network price chart, the outlook remains negative for the short term. As long as the PI price stays below the trendline and fails to reclaim levels above $0.74, sellers are likely to stay in control.
That said, there’s still a chance for a bounce if the $0.71 support holds. If it does, the price might recover toward $0.76 or even test the $0.82 area again. But if $0.71 breaks, then Pi coin price could drop quickly toward $0.619 before any possible recovery attempt.
Read Also: Aptos (APT) Breakout Retest Complete: Is a Major Rally Now Underway?
Traders will need to watch this key zone closely today. A close below $0.71 could change the outlook to much more bearish, while a hold above it might offer a brief bullish reprieve.
As of now, most signals favor the bears, but with RSI and Stochastic both oversold, short-term volatility can’t be ruled out.
Subscribe to our YouTube channel for daily crypto updates, market insights, and expert analysis.

We recommend eToro
Wide range of assets: cryptocurrencies alongside other investment products such as stocks and ETFs.
Copy trading: allows users to copy the trades of leading traders, for free.
User-friendly: eToro’s web-based platform and mobile app are user-friendly and easy to navigate.