Pi Coin had a bumpy ride again, dropping nearly 15% to around $0.9193, even after briefly touching $0.9475 earlier in the day. The drop came right after the token broke above a key downtrend line that had been holding it back since March. On top of that, trading volume slipped by over 10%, showing that momentum is starting to cool off.
Earlier this week, Pi Coin price made a strong push above $1.50 but couldn’t hold onto those gains. That breakout attempt ran into heavy resistance, leading to a round of profit-taking. Since then, the price has pulled back to the $0.90 area, which is now acting as a potential support zone thanks to that earlier trendline breakout.
What you'll learn 👉
What the Pi Coin Chart Is Showing
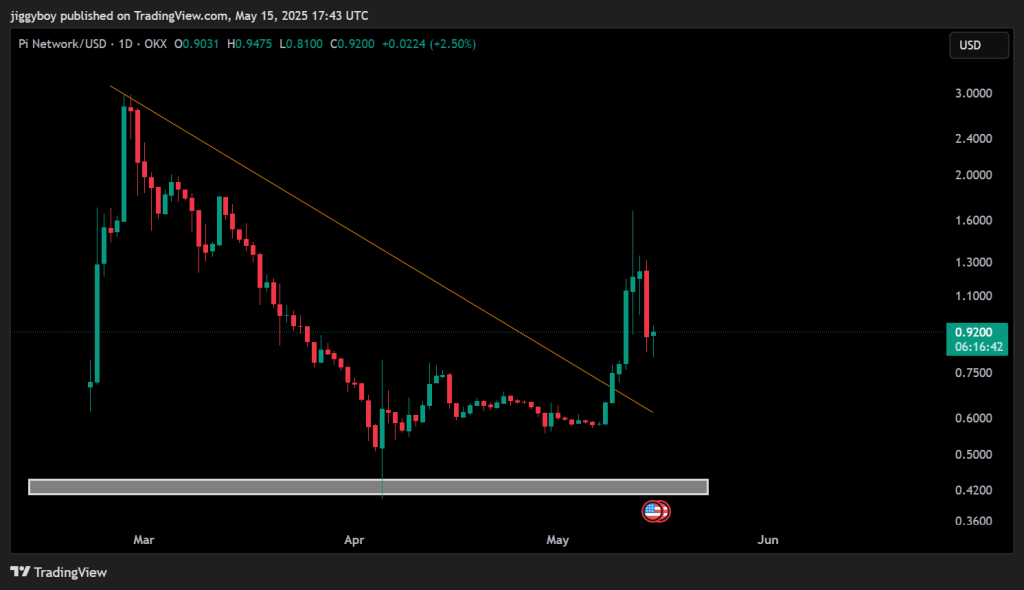
The daily chart shows that Pi Coin price has broken above a multi-week descending trendline but is now in a retest phase. The $0.90 level, where price is currently hovering, aligns with the previously broken trendline and could serve as a support zone if bulls step in.
Read Also: Here’s Why Monero (XMR) Price Is Pumping
Below that lies a wider demand zone between $0.40 and $0.45, which was tested in April and held firmly. Price rejection near $1.50 and the long upper wick suggest that sellers are still strong at higher levels. If current support fails, traders may look for bids near $0.75 or lower. However, holding $0.90 could open up room for a fresh push back toward the $1.00 area.
Technical Indicators (Daily Timeframe)
| Indicator | Value | Interpretation |
| RSI (14) | 57.13 | Bullish momentum building |
| MACD (12, 26) | 0.101 | Positive crossover, buy signal |
| CCI (14) | 41.81 | Neutral, no clear direction |
| Ultimate Oscillator | 53.38 | Mild bullish pressure |
| ROC (Rate of Change) | 53.25 | High momentum, buyers active |
| Bull/Bear Power (13) | +0.0213 | Slight bullish advantage |
Most indicators lean bullish. Momentum remains on the side of the bulls, but not with overwhelming strength. CCI is neutral, suggesting no immediate trend reversal but also no overbought signal.
Pi Coin Price Forecast for Today (May 16)
- Pessimistic Case
- Target: $0.75 – $0.80
- If the $0.90 level fails to hold and volume continues to fade, Pi Network price could revisit its previous consolidation zone. This would reflect a full retrace of the earlier breakout.
- Realistic Case
- Target: $0.80 – $0.95
- Sideways action is likely around current levels. Traders are watching for confirmation before taking directional positions, especially after the sharp drop in volume.
- Optimistic Case
- Target: $1.00 – $1.05
- If bulls successfully defend the $0.90 support and volume picks up again, Pi Coin price could retest the $1.00 zone. A clean break above $1.05 would set the stage for renewed bullish momentum.
What We Got Right Yesterday
In our May 15 prediction, we outlined three scenarios, with the realistic case ($0.80–$0.95) as the most probable. Pi Coin price is now trading right within that range, confirming our expectation of consolidation following the failed breakout. The $0.90 level is acting as key support, as anticipated, while volume and momentum indicators show cautious optimism but no aggressive trend shift yet.
Subscribe to our YouTube channel for daily crypto updates, market insights, and expert analysis.

We recommend eToro
Wide range of assets: cryptocurrencies alongside other investment products such as stocks and ETFs.
Copy trading: allows users to copy the trades of leading traders, for free.
User-friendly: eToro’s web-based platform and mobile app are user-friendly and easy to navigate.